What is the "Best" Forward-Looking Prediction Measure for MBS credit performance?
March 18, 2025
MBS market participants analyze numerous credit metrics to assess the credit health of their assets. Among them are:
- Delinquencies
- CDRs (Constant Default Rates)
- Specific Credit Rolls
- Credit Transition Matrix
Which of these is the "best" predictor of future credit performance for MBS loans? Below are our thoughts on this, along with a few examples:
Delinquencies
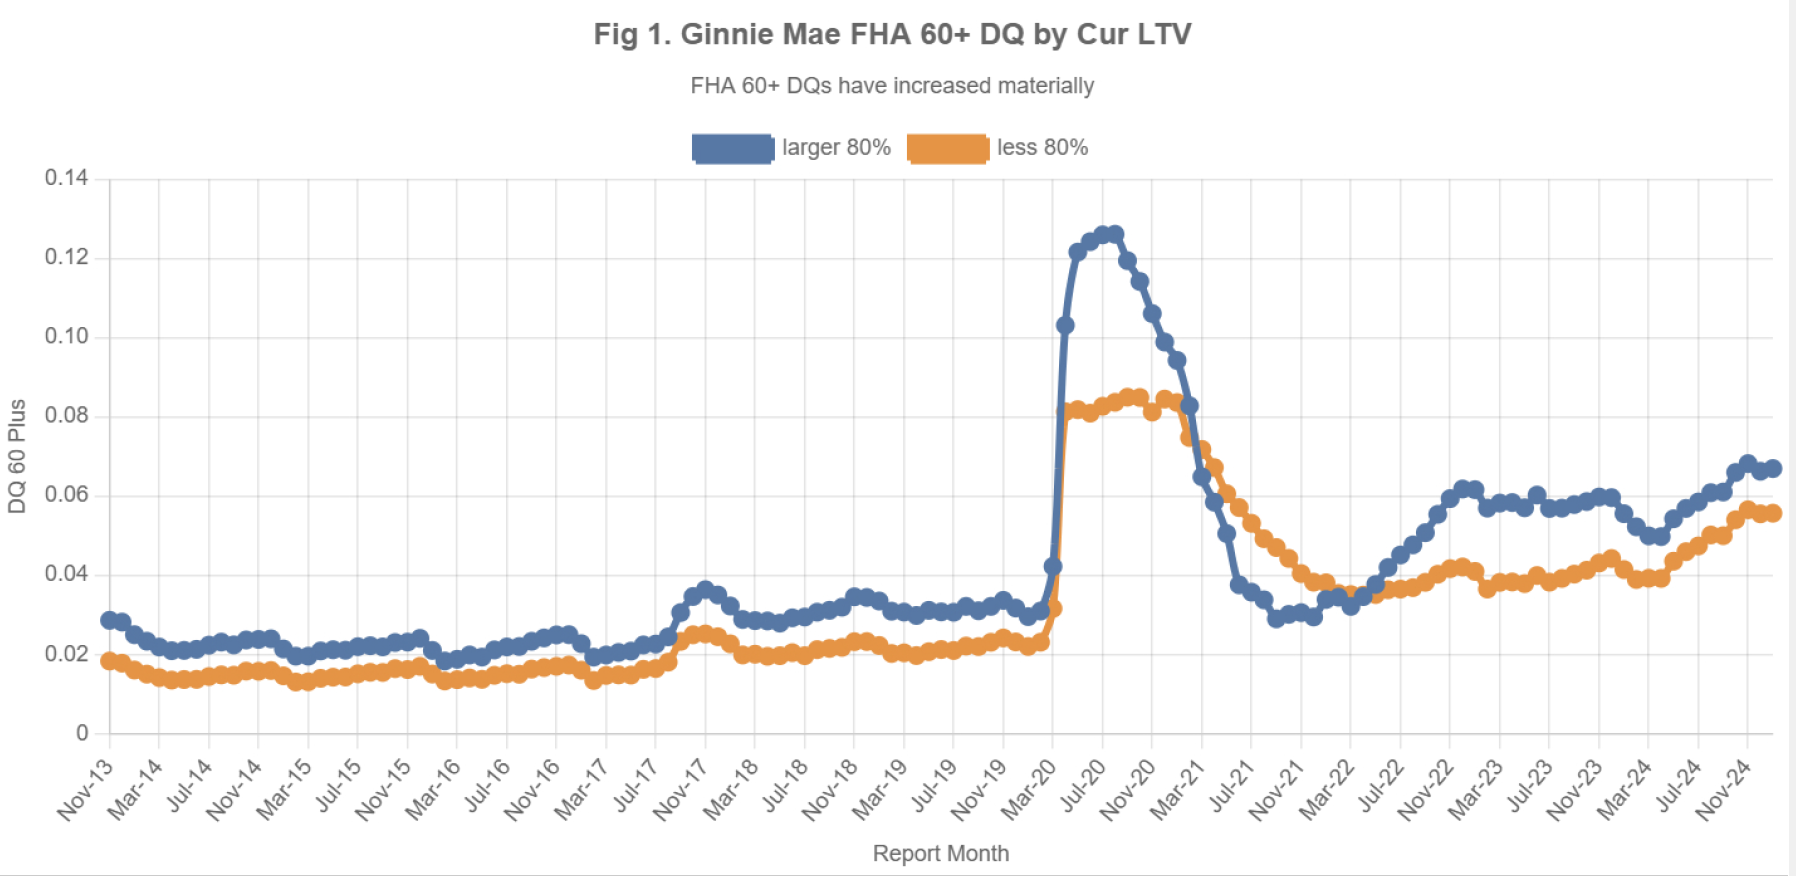
Delinquencies reflect the historical performance of the collateral. In the case of Agency MBS, they also capture servicer (for Ginnie Mae loans) or GSE buyouts (for conventional loans). As a result, delinquencies are not a good predictor of future credit performance (see Fig. 1 for Ginnie FHA 60+ DQs).
It is possible to adjust for buyouts, as demonstrated here, but delinquencies still remain a historical metric rather than a forward-looking one.
CDRs (Constant Default Rates)
In Agency MBS, CDRs represent loan buyouts so they are not directly related to collateral credit performance. In Non-Agency MBS, Default definitions may vary (e.g., may be defined as REO or Loss Recognition), but they typically lag actual collateral performance by many months or even years.
Specific Credit Rolls
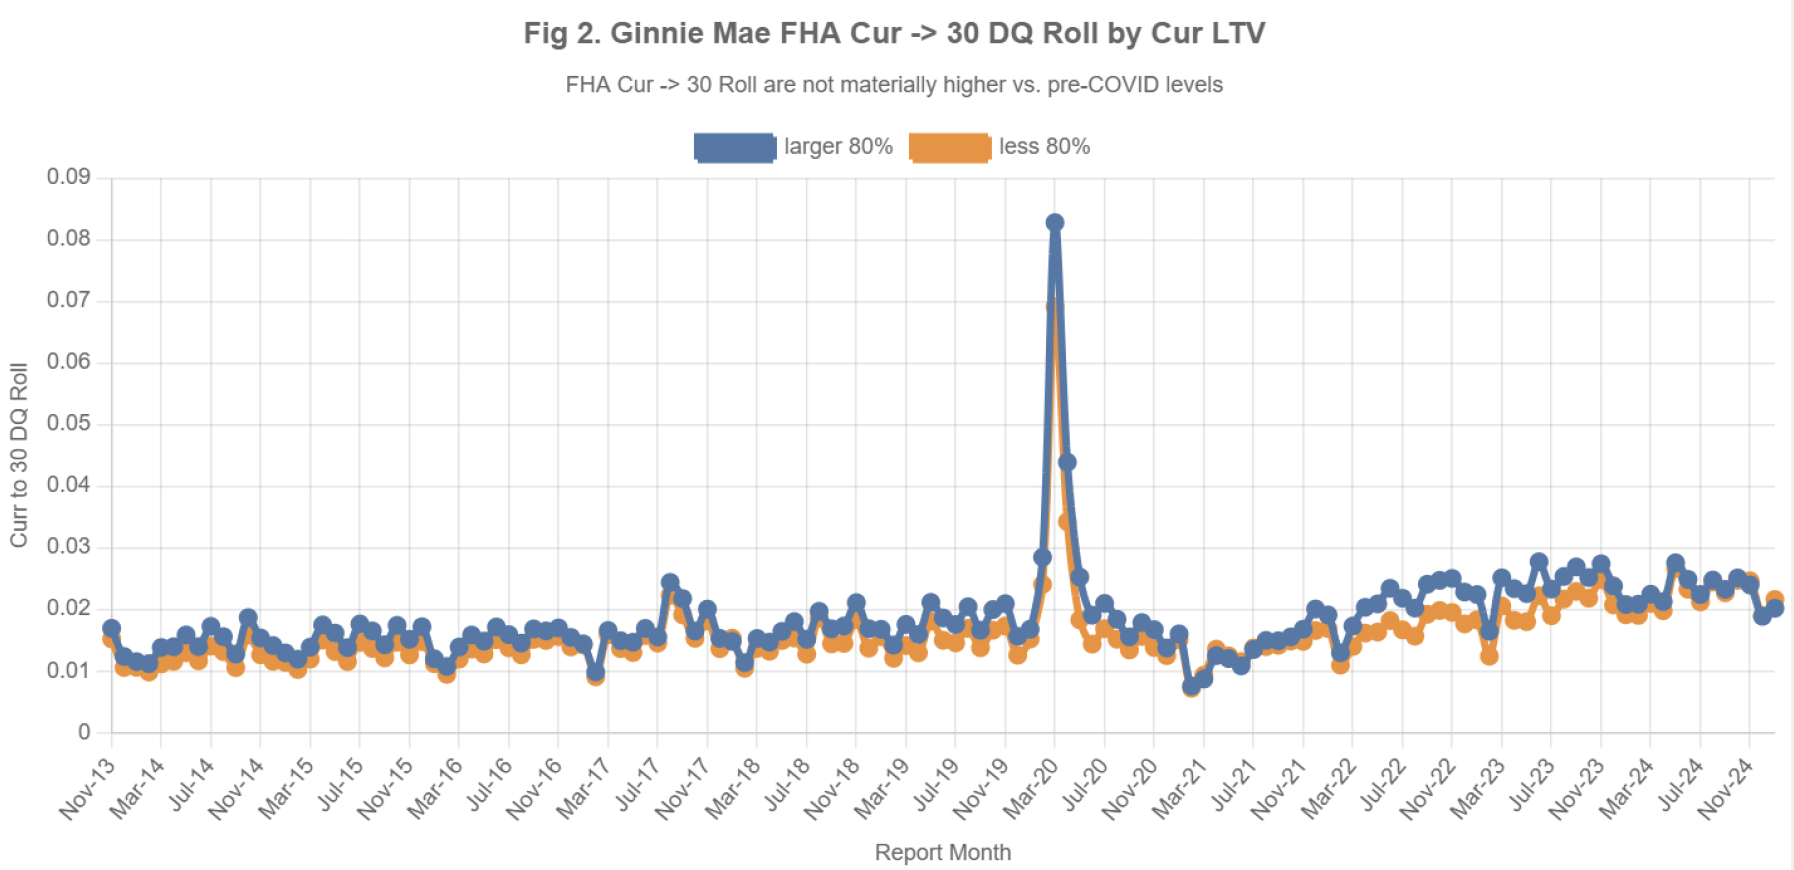
Fig. 2 illustrates the Cur -> 30 DQ roll, which represents the monthly probability of a current borrower becoming 30-day delinquent. This is one of the earliest indicators of emerging credit issues and is typically not influenced by servicer behavior.
Thus, we view Specific Credit Rolls as the best leading indicator of credit performance. This explains why Fig. 1 and Fig. 2 may appear contradictory – Fig. 1 shows increased delinquencies, while Fig. 2 indicates that the Cur -> 30 DQ roll is only slightly above pre-COVID levels. Based on this, we believe FHA credit performance will remain stable moving forward. More details on the current high FHA delinquency levels can be found here.
Credit Transition Matrix
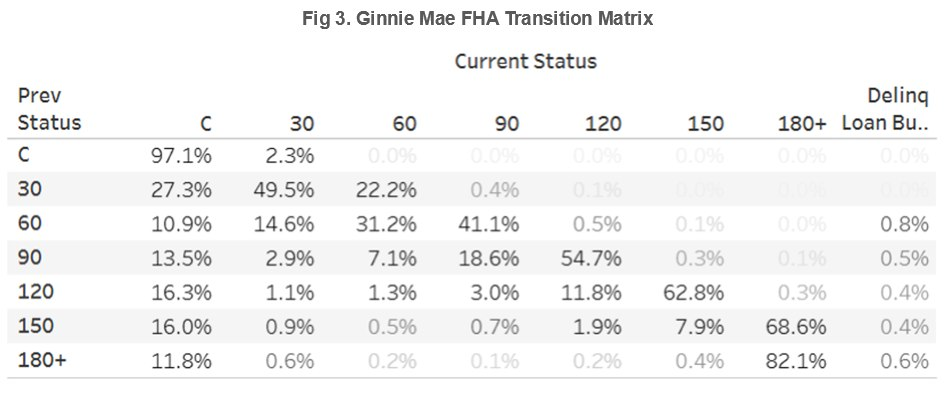
What about the other credit rolls? Fig. 3 presents a Credit Transition Matrix, which shows the monthly probability of loans transitioning between different credit states.
To forecast credit performance, one simply multiplies this matrix forward for the desired number of forecasted months. We believe this is the most effective method for predicting MBS credit performance. As a result, our data-driven valuation technology is designed to leverage this approach.
Please let us know if you would like our assistance with data-driven credit analysis of your portfolio!
Why Choose Us?
With over 20 years of experience and a proven track record in data and analytics development, IVolatility serves more than 500 institutional clients and 130,000 retail customers. Now, we're bringing this expertise to MBS data and analytics. Discover the benefits of using IVolatility solutions for MBS HERE.
Discover the benefits of using IVolatility solutions for Mortgages:
Got a question or a comment?
We're here to serve IVolatility users and we welcome your questions or feedback about the MBS data insights discussed in this post. If there is something you would like us to address, we're always open to your suggestions. Please let us know!
Previous issues are located under the News tab on our website.