Tracking the Volatility "Skew"
February 13, 2025
The Markets at a Glance
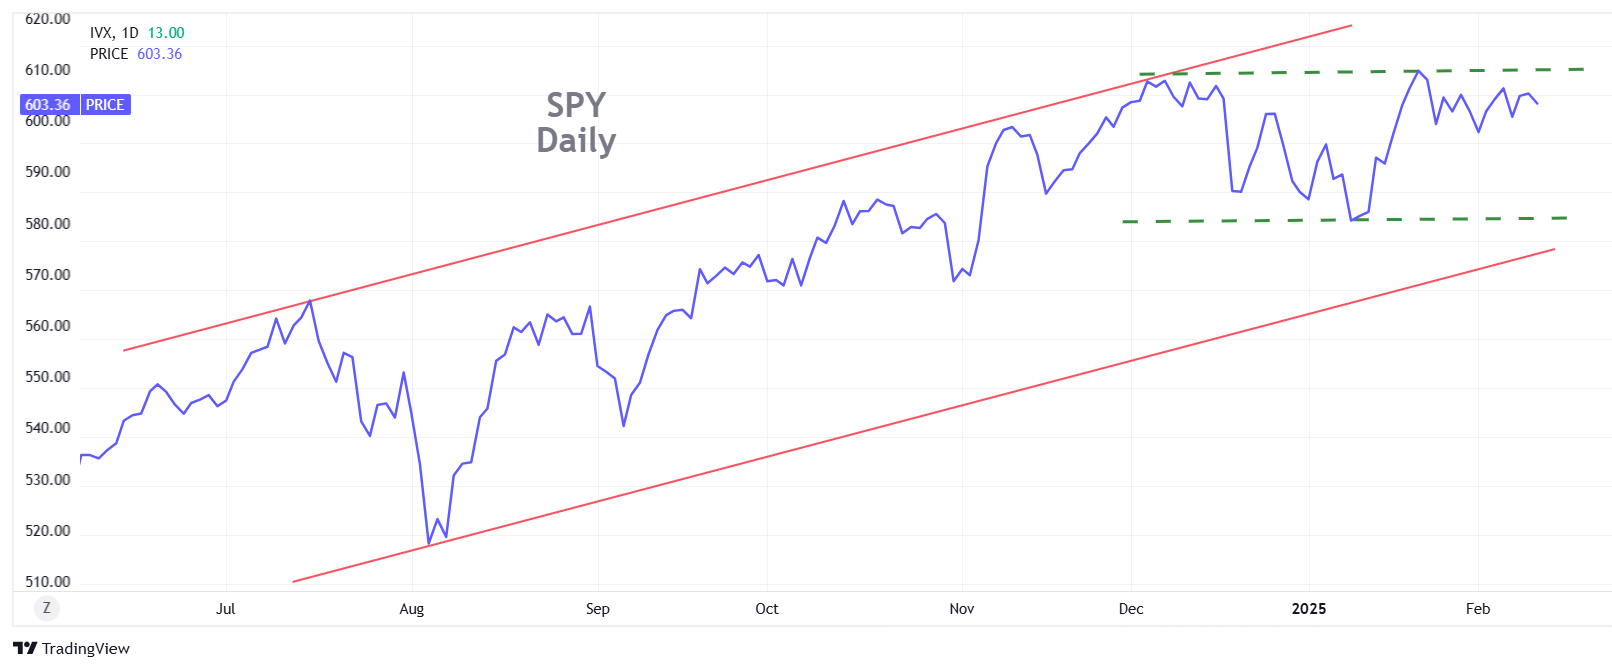
The long-term uptrend remains intact but the daily whipsaw continues as markets digest a barrage of new tariffs on imports and assess the reactions of industry leaders and trade partners. Reactions are all over the map as Trump delivers action items in rapid fire, even while many are being questioned and challenged.
Meanwhile, even without the tariffs having time to cause inflationary pressure of their own yet, the CPI crept higher in the latest reading to 3.1% year over year, primarily due to higher food and energy prices. That caused Fed Chairman Powell to admit that the plan to continue lowering interest rates is now on an extended hold. The futures markets got the message and are now pricing in just one potential 25 bps rate cut very late this year. The words few people dare to speak are that any further increase in inflation (which the tariffs are will likely produce if they persist) could even potentially lead to a rate hike instead.
So, without a rate cut in the near future, will corporate America prosper with less migrant labor and more tariffs. And when will the bloom come off the dual roses of the new administration and AI?
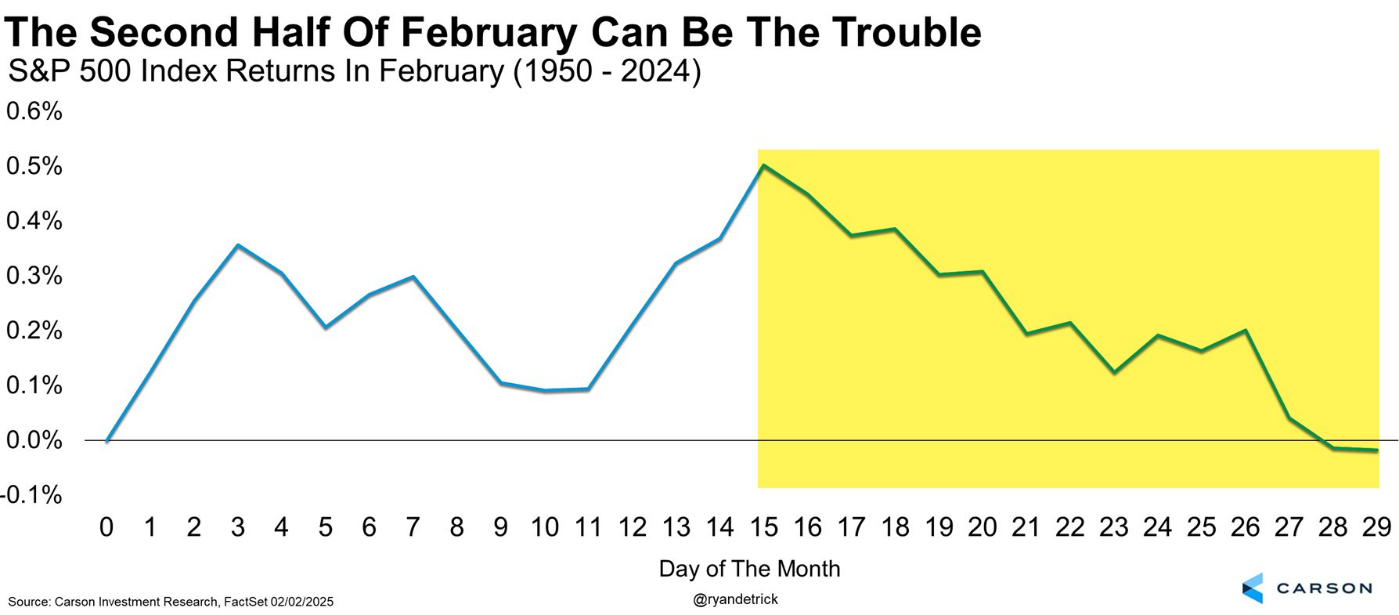
Some market technicians have recently weighed in on that question. Ryan Detrick, Chief Market Strategist at Carson Group, points out that the first quarter following an election year tends to be among the weakest of the entire four-year cycle, and February the worst month. Moreover, he tallied the performance of the S&P 500 in all Februarys between 1950 and 2024, concluding that mid-Feb tended to be a peak, followed by a decline in the remainder of the month. (His chart is included below.)
So far, the market has held up since the election. But the inability to get upward momentum going again (as in new highs) should signal some caution. In addition, numerous opening declines in the past weeks have staged intraday recoveries but subsequently failed at prior peaks. This tells me that there are a lot of people still buying dips but that no one is willing to buy any more at the highs. What will happen when the dip buyers are no longer there?
For these reasons, I've taken a much more cautious stance lately, which means not just call-writing on existing positions, but some outright put or put spread purchases as a hedge.
Strategy Talk: The CBOE Skew Index ($SKEW)
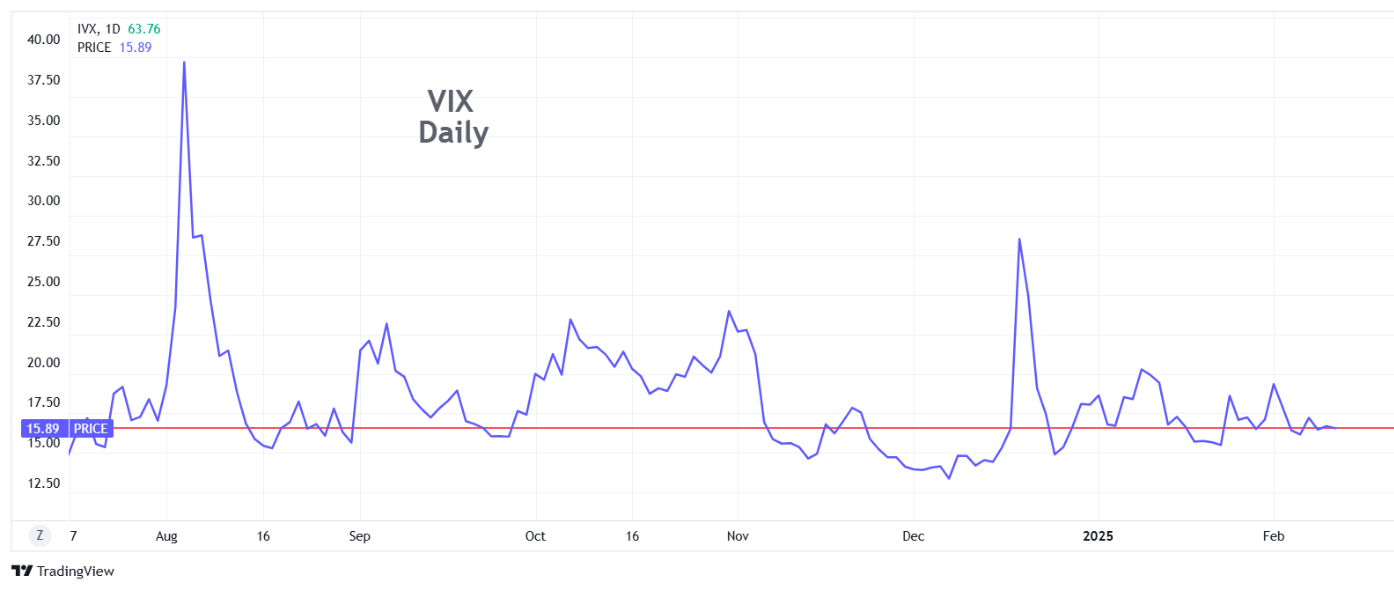
Last week I pointed out that the equity market has been experiencing more volatility lately, even though it was not showing up in the CBOE Volatility Index ($VIX). That's because VIX only measures the volatility on one specific item and has a rather rigid and narrow definition. It serves as a useful benchmark for overall equity market implied volatility but doesn't tell the whole story.
To understand why not, we can review the parameters of VIX:
As a result, VIX does not reveal the following:
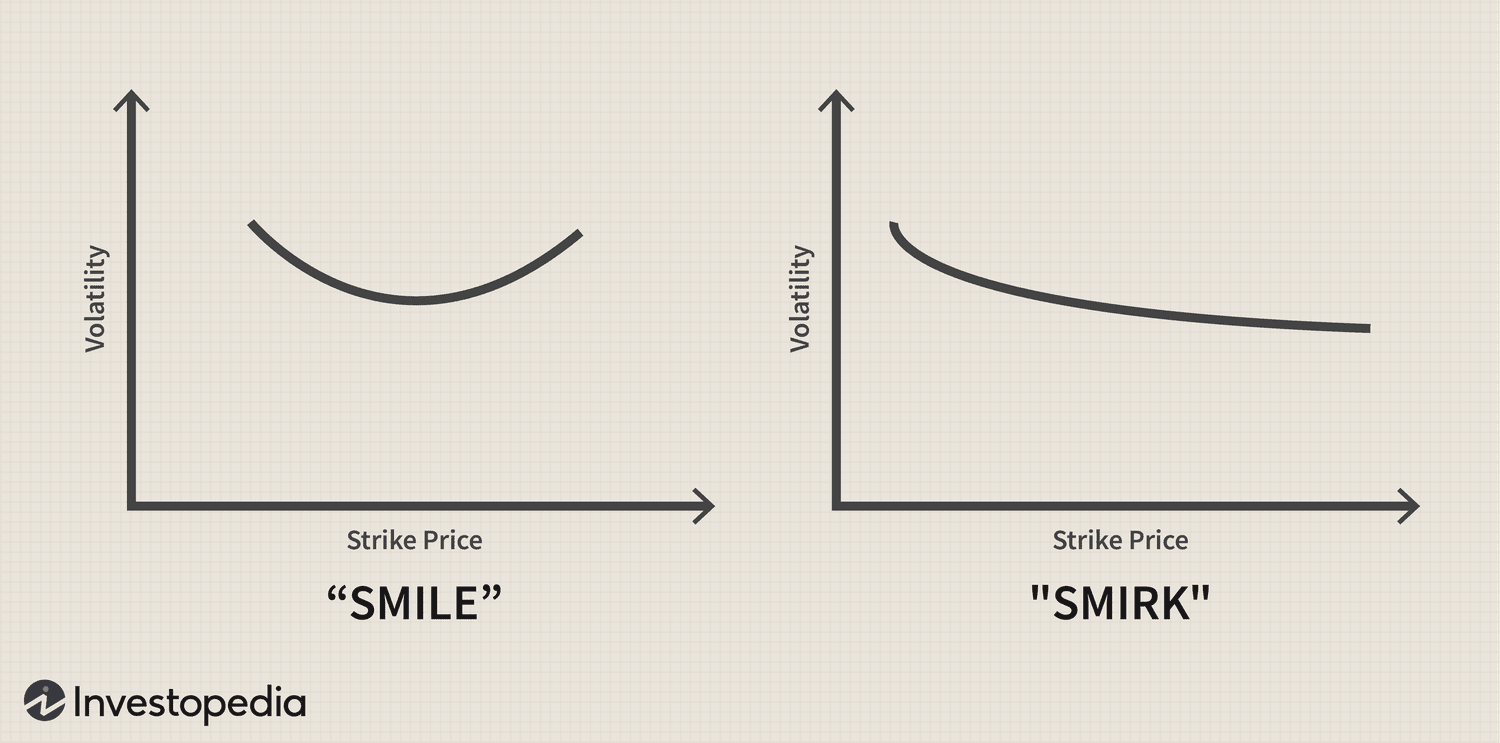
Since implied volatility is based on the market price of an option, every option available on a particular stock will generate an IV and they will all be slightly different. (You can see that just by looking at any option chain that shows implied volatilities.) We usually focus on the ATM call option in any expiration since it is expected to have the lowest, and most representative IV. Strikes above or below the ATM will expectedly generate consecutively higher IVs, forming a curve that is referred to as the volatility "smile", pictured below for any specific expiration.
When comparing IVs between different expirations, we can see if there is a time skew. Time skews occur when the market expects a stock to be more or less volatile than normal due to an event, such as an earnings or product announcement. Time skews are somewhat easy to observe by comparing the IV of a given strike in one expiration to that of the same strike in another expiration.
Without any expected events, such as an earnings or product announcement, IVs are theoretically similar across different expirations at the same strike price, so time aberrations can be seen rather easily. Skews across different strike prices in the same expiration are more difficult to discern because they are not expected to be similar to begin with, as the smile chart shows. Strike skews occur when the market assigns a greater or lesser IV to lower or higher strike prices from the ATM. Strike price skews can look like the "smirk" in the chart above.
A strike price skew in implied volatility occurs when traders bid up either the lower strikes or the higher strikes. (Because of option-stock arbitrage at any strike price, puts and calls will generally show a similar smirk.) Both time and strike skews can provide sophisticated opportunities for option arbitrage strategies, but their more common use is as a potential indicator of future movement.
There is no index for time skews, but there is an index for strike skews. It's called the CBOE Skew index ($SKEW).
The SKEW index is calculated using S&P 500 options that have strike prices representing 2-3 standard deviation moves from the current stock price (the assumed mean). The purpose of the index is to measure tail risk over the next 30 days. Thus, while VIX measures implied volatility of the ATM strike price, SKEW measures the implied volatility of out-of-the-money (OTM) strikes.
A graph of SKEW since inception is shown below.
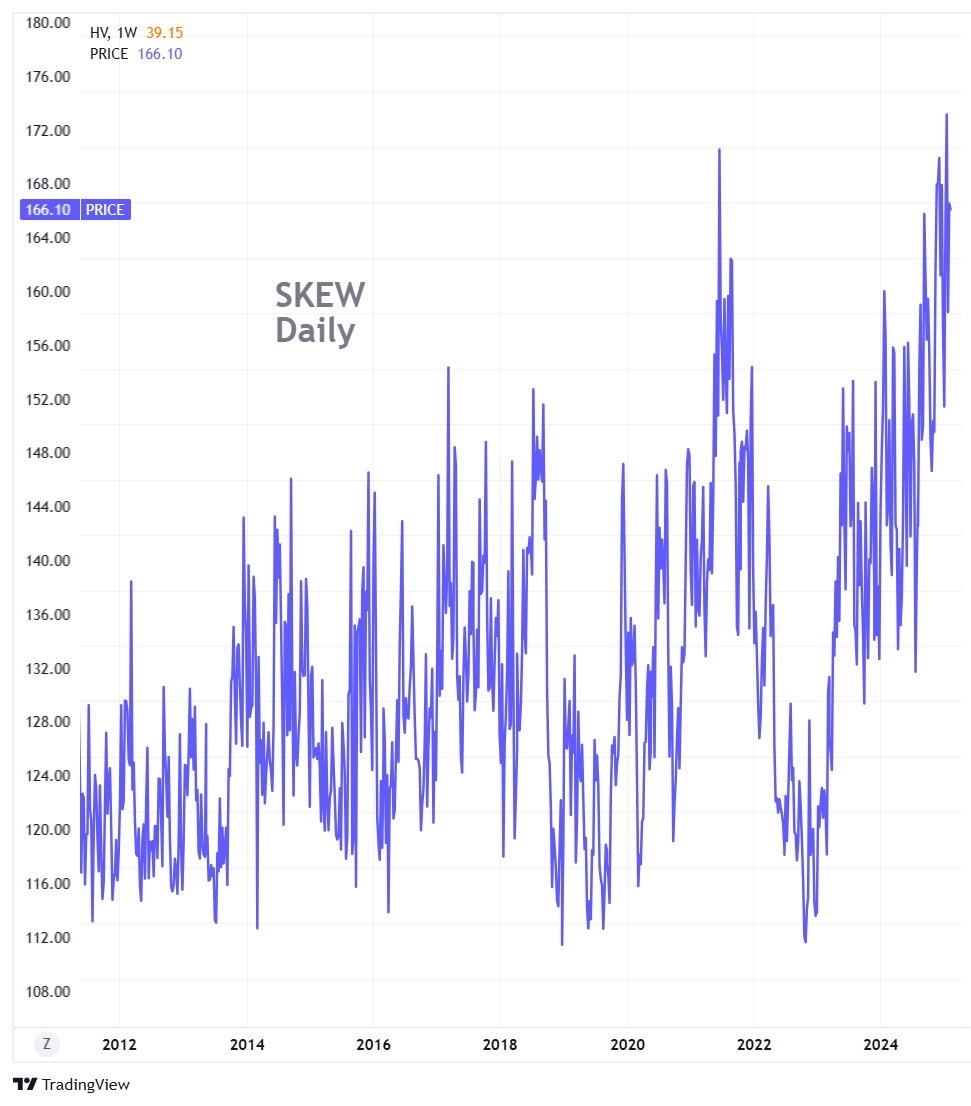
SKEW values generally range from 110 to 140, but the chart above shows their entire history. And right now, they are at an all-time high. Those who have studied SKEW say its predictive value for a true tail event has not yet been effectively demonstrated. But it does tell us that the implied volatilities of OTM options is currently at multi-year highs relative to the ATM options (even while VIX is at a very modest level).
Is the SKEW telling us something? Draw your own conclusions.
For additional information on SKEW, go to the CBOE web site. Their white paper on it can be downloaded HERE.
Got a question or a comment?
We're here to serve IVolatility users and we welcome your questions or feedback about the option strategies discussed in this newsletter. If there is something you would like us to address, we're always open to your suggestions. Use support@ivolatility.com.
Previous issues are located under the News tab on our website.