Perspectives on Volatility
February 6, 2025
The Markets at a Glance
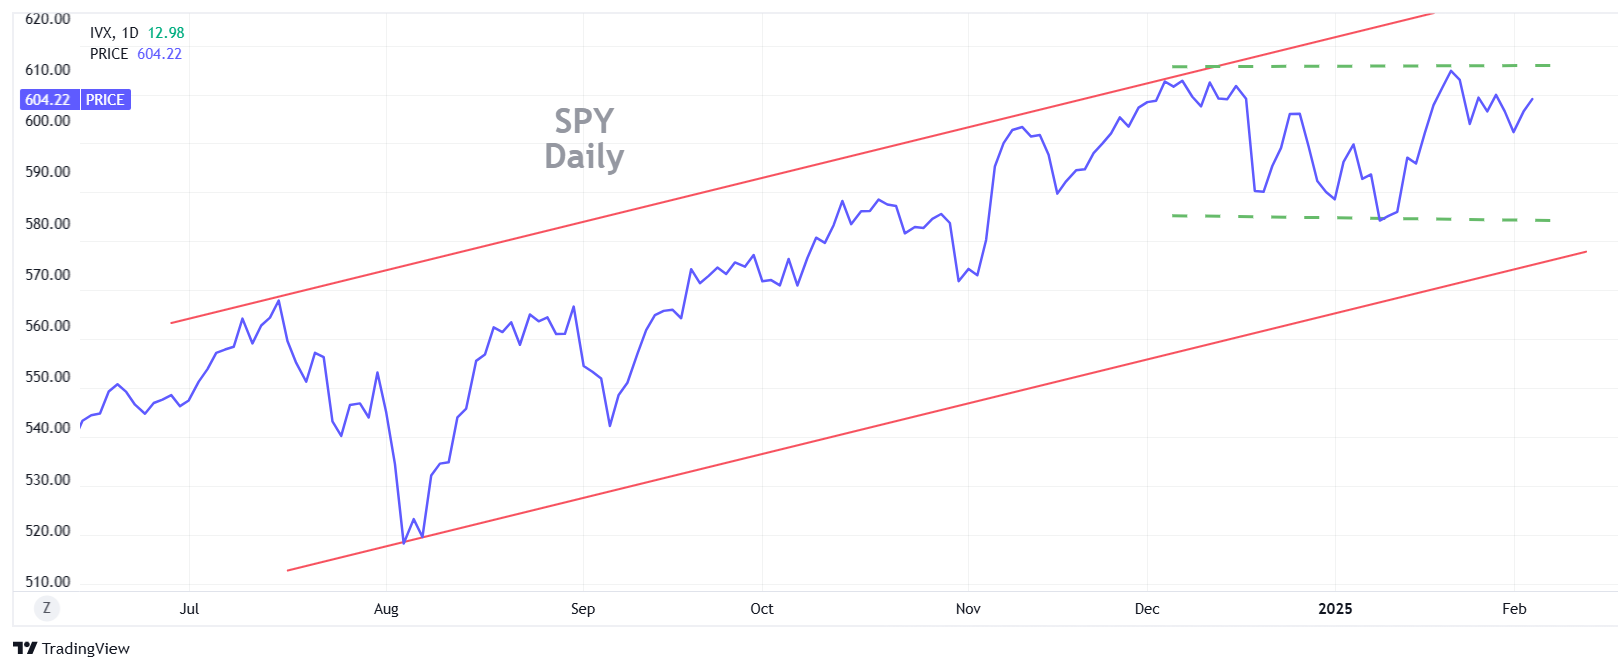
While still solidly in the long-term uptrend of 2024, the SPY has experienced an exacerbated level of intraday spikes and reversals, primarily due to the recent barrage of actions and statements by the new Trump administration. Making matters uniquely challenging for traders, there have been statements made (i.e. on tariffs for example) that could have significant economic impact, only to be reversed days later. Traders will now need to get accustomed not only to assessing the impact of political actions and policies, but to determining whether they are real or simply a threat.
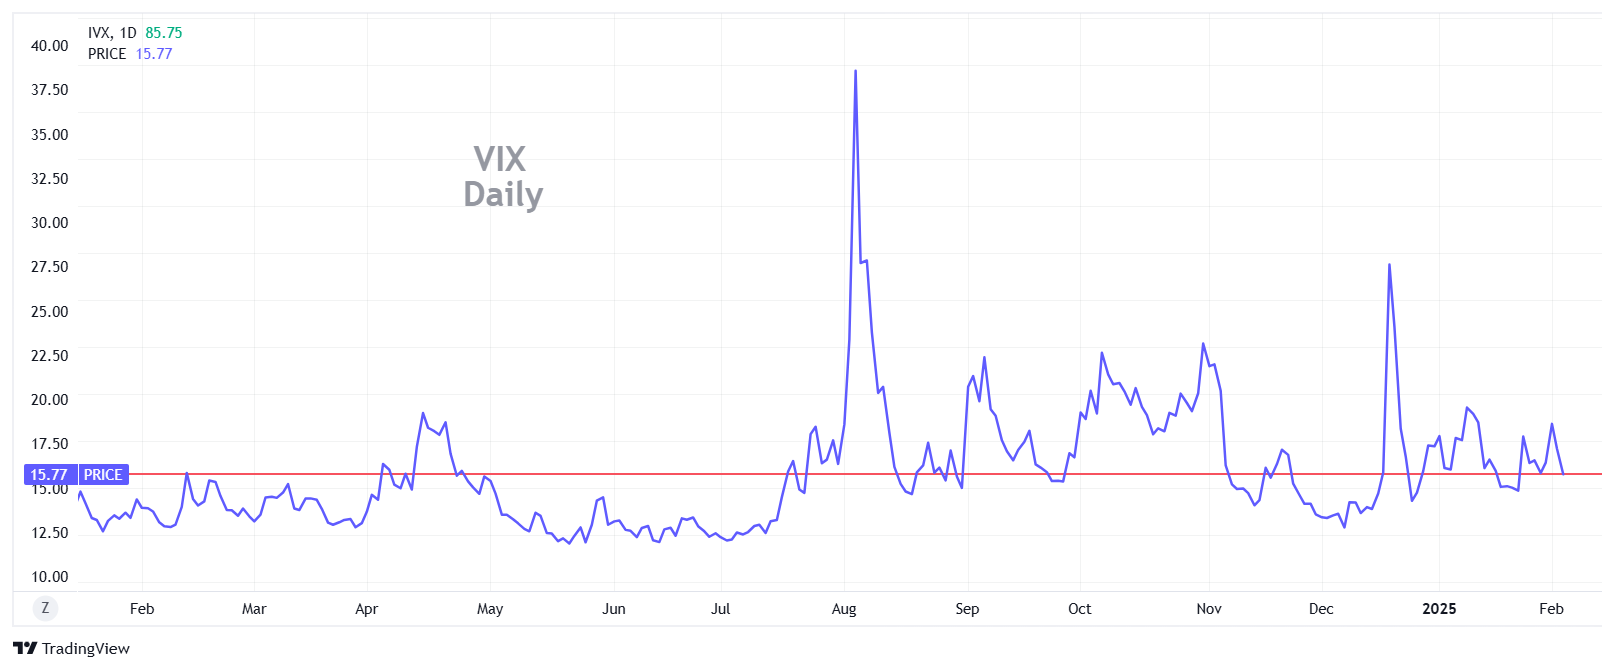
Though overall volatility (as measured by VIX) remains somewhat subdued at 15-16, there has definitely been more intraday action lately, including some key reversals and accelerations that seem to come out of nowhere. It's important to reconcile the difference between VIX, which measures volatility in daily terms and the intraday action we've seen lately, which has no index to quantify it. (More on this in the Strategy section below.)
Overall, the intraday activity recently has resulted in shifts among companies and industries affected by new policies, rather than a defensive shift into bonds or utilities. This churn has resulted in a leveling out of the SPY since December, within the longer-term trend channel boundaries. That leaves SPY less than 1% from its all-time high, QQQ less than 2%, and IWM less than 6% – a position that can be interpreted generally as a continuation of recent strength, but which has some people concerned about its fragility at these levels.
Keeping in mind that analysts and economists largely acknowledged toward the end of 2024 that 2025 was unlikely to see a repeat of the level of performance of '23 and '24, a leveling out without a serious correction may actually be good news. However, the internal nature of the market will not be the same now as it was during the prior administration. So, while the overall level of the market may hold up, we should expect more volatility within sectors and intraday.
Strategy Talk: Perspectives on Volatility
As perhaps the single most important concept associated with options, volatility is something every options trader should be well acquainted with. That means understanding the difference between the volatility we see in the market and the volatility defined by the common statistical definition.
We all know that, in concept, the volatility of stocks and ETFs represents their cyclical up and down movements over time and that the inherent volatility of a security has a substantial effect on the values of options traded on those securities. But that is grossly oversimplified. Here are some facts about volatility that are important for all option traders to understand.
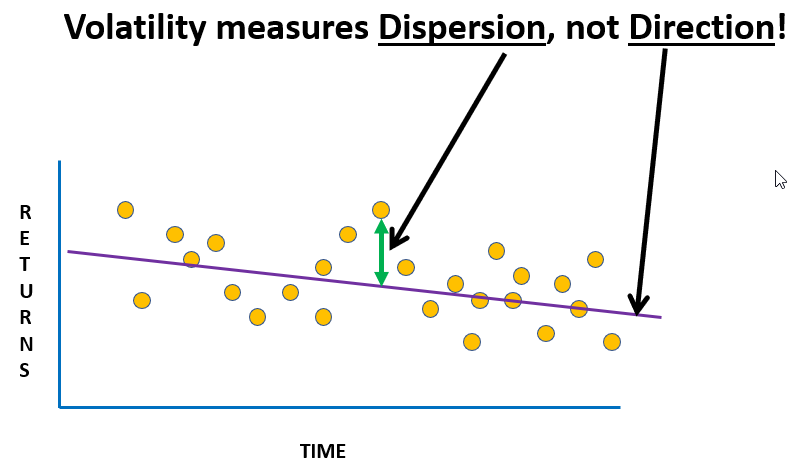
1. The widely accepted measure of volatility for any security is defined to be the standard deviation (or dispersion) of its daily returns over a designated time period. It is then annualized and expressed as a percent.
Right away, this raises the question of how long the time period should be for the measurement. The dispersion of returns for any security can vary by a substantial amount over time. The dispersion over the last month will be different than the dispersion over the last six months or the dispersion for calendar year 2024.
That's because price and volatility are a function of market forces, which are fluid and unpredictable. Industry type naturally makes a difference (a technology company's revenue stream is inherently less stable than, say, a bank or utility), but that cannot explain why any particular stock's up-and-down movements vary over time, even when their business or revenue projections have not materially changed.
The resulting volatility calculation for any security is expressed as a percent and annualized from whatever period the source used. It is then assumed to represent a guide to the stock's possible volatility over the next year.
2. The (historic) volatility calculation is then used as the default expectation for the future and used as an input to option pricing models. The same volatility calculation is typically used to determine the theoretical value of all option strikes and durations.
The historic volatility of any optionable security is then used to determine the theoretical price of options on that security. Market Makers and Specialists on the exchanges will commonly use the theoretical value calculation to set the quotes on the options for any particular stock they are responsible for. If supply and demand sets a higher or lower price for options than theoretical value suggests, Market Makers and Specialists will adjust their quotes accordingly. To do that, they can simply raise or lower the volatility figure used to determine option quotes and do so easily for all option strikes and durations simultaneously.
The modified volatility figure used by Market Makers and Specialists essentially becomes the "Implied Volatility" of the options on any particular stock.
3. The volatility of any security is not constant over time.
Historic volatility is calculated the same way by everyone, but it will vary over time and will be dependent upon the time period being measured. The industry has generally settled on an accepted time period of 100 trading days (4-5 months) but that is not necessarily universal. That also means that historic volatility could differ among different data sources if they use a different time period, though it would be consistent for all securities monitored by that source.
Over time, volatility for any security can vary relatively little or quite a lot. The changes are a function of news or developments regarding the underlying business as well as economic conditions, interest rates, and investor sentiment. For perspective, a stock with a volatility of 40% might vary from 25% - 60% from period to period. It is not uncommon for the volatility of a security to double or triple when something significant occurs. Sometimes stocks will revert to their former volatility level after news and sometimes not.
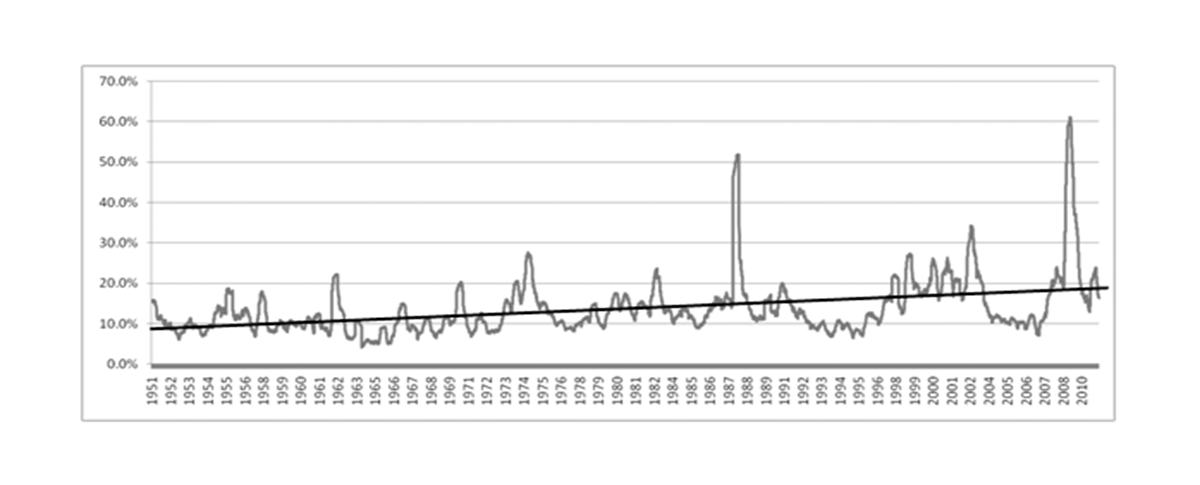
As a benchmark, the long-term annual chart of the CBOE volatility index below shows how much the volatility on the S&P 500 index has varied over time. One can also see that it has steadily risen as well.
CBOE volatility index (reconstructed for data prior to 1993)
4. Volatility does not measure intraday moves.
Since volatility is calculated on the variance in daily returns, several things can occur that might be counterintuitive with the calculation.
- A stock can go up 1% every day for six months, giving it a 100% return in the 100-day period. The volatility of such a stock would be zero.
- A stock can also go up 1% one day and down 1% the next, repeating this pattern for 100 days. Its volatility would also be zero.
- A stock can have wild movements for months, returning to its original price in 100 days for a net return of zero, but have a potentially large volatility.
- A stock can have wild intraday movements and reversals but relatively low volatility if daily returns are somewhat consistent. This may be happening now as the volatility of the S&P 500 average (VIX) was 15.77 on Wednesday's close but intraday moves and reversals have been consistently higher than normal for weeks.
The bottom line for traders is to recognize that VIX is a useful benchmark for market volatility overall but does not tell the whole story. Digging deeper into stocks, sectors, economic conditions, time periods, and intraday action is also sometimes necessary.
Got a question or a comment?
We're here to serve IVolatility users and we welcome your questions or feedback about the option strategies discussed in this newsletter. If there is something you would like us to address, we're always open to your suggestions. Use rhlehman@ivolatility.com.
Previous issues are located under the News tab on our website.