Volatility and Mayhem are Different
January 23, 2025
The Markets at a Glance


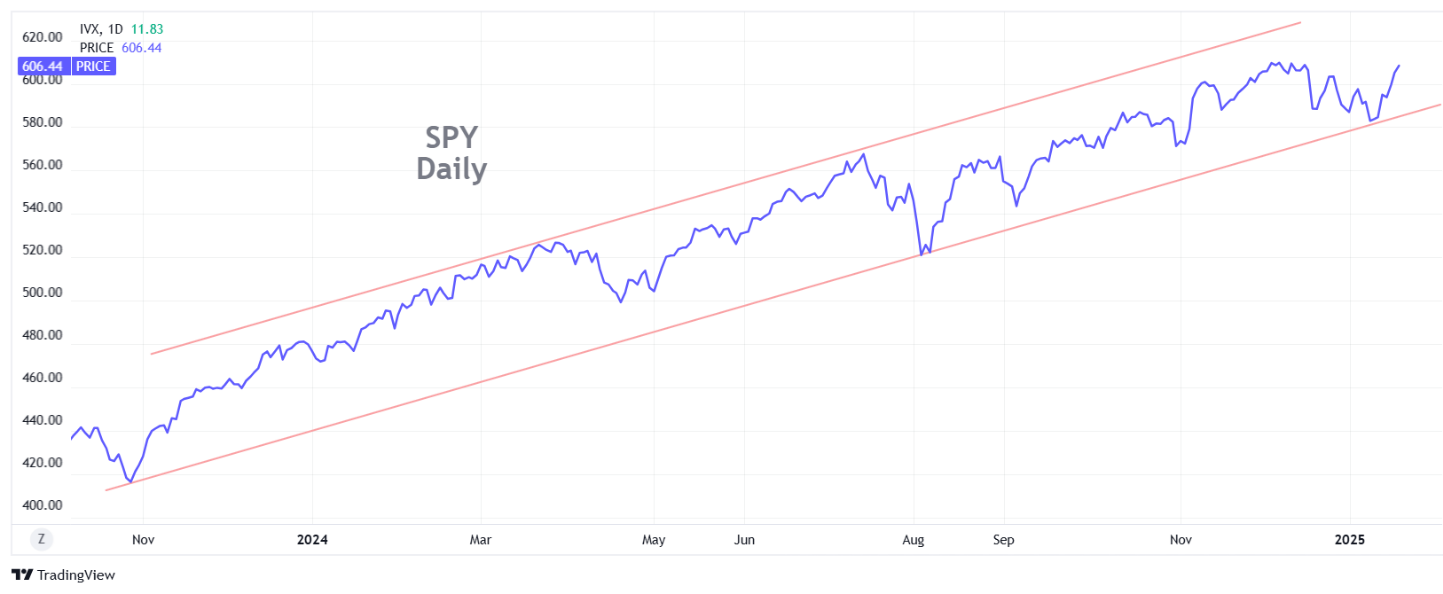
The market appears to be loving what Trump has fired off during the opening days of his presidency, though not all sectors are uniformly going up. Industrials, materials, energy (fossils), technology, and financials have all been leading the way up. Healthcare is modestly up. Utilities were up until pulling sharply back today. And of course bitcoin is rallying again.
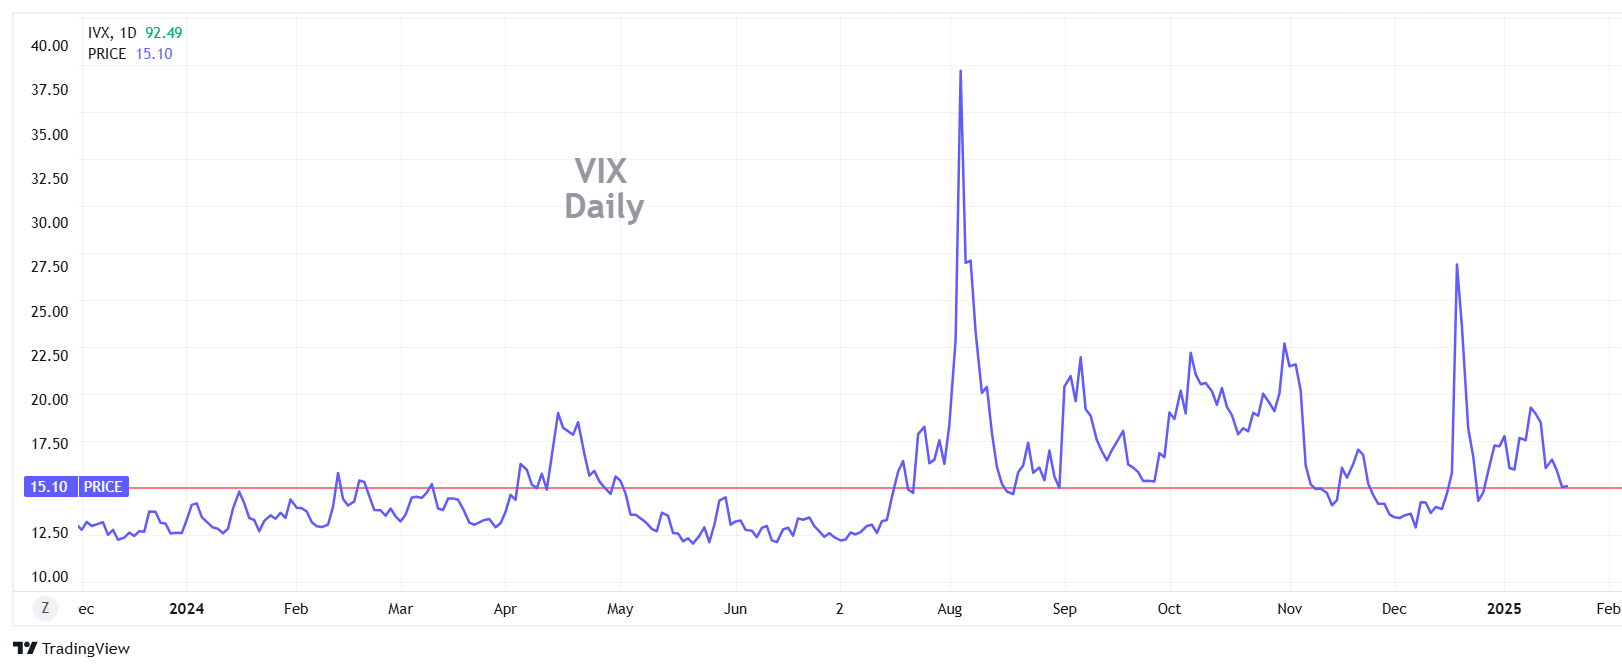
But the small caps (IWM) stopped sharply on resistance on Tuesday and didn't go any further yesterday. Also, green energy (TAN) was down. VIX has softened to around 15, which is not surprising in a rally.
So, while SPY hit a new high, neither RSP, QQQ, or IWM did and IWM remains about 10% below its December peak. What we can glean from all this is that the market is generally happy with Trump's policies, but that love is not necessarily going to the same companies and sectors as it did in the fall. Plus, while there is less volatility, there is more "mayhem", which I'll explain below. Welcome to Trump 2.0.
As I pointed out last week, this rally, just like the election rally, is entirely anticipatory and is coming along with unbridled enthusiasm by many people for what the Trump administration will bring. Literally none of that enthusiasm, however, has shown up in anyone's bottom line yet. So, I still feel protective measures are warranted and that's where options shine.
Strategy Talk: Clarifying SVOL and Distinguishing IV from Mayhem
Last week, I introduced you to the Simplify Volatility Premium ETF (SVOL) and I mentioned that its strength was in its yield while showing a graph of the price exhibiting a decline over time. To clarify, the graph of SVOL is commonly shown using actual share prices, not adjusted for dividends. This makes it appear as if the fund is simply returning capital to investors rather than paying a true positive yield – a tactic some funds us to attract yield investors.
SVOL has been paying dividends of between $.26-.30 per month since its inception in 2021 which tend to represent 1-1.5% each month. Its share price during that time began at 25.75 and closed on 1/23/25 at 21.62. So, it is paying out more each year in monthly dividends than it actually earns, but it still generates a positive overall return.
SVOL's Total Return performance (from Yahoo Finance through 1/21/25) has been as follows:
YTD: 3.31%
1-year: 9.81%
3-year: 10.66%
Again, I am not bringing this up to advocate owning it as a long-term yield play, but rather to point out that when VIX is high and expected to come down, it can be useful for capturing value as VIX retreats and delivering it through a combination of appreciation and yield over short to medium time horizons.
With VIX at 15, I do not feel a current need to play it on the downside. Given the initial rollout of the Trump administration, I think it will be a while, even with markets rising, that we see VIX drift down to the lower teens again, where it was for much of Biden's last year in office. I would be more inclined at the current time to play VIX on the long side, waiting for the next spike above 20.
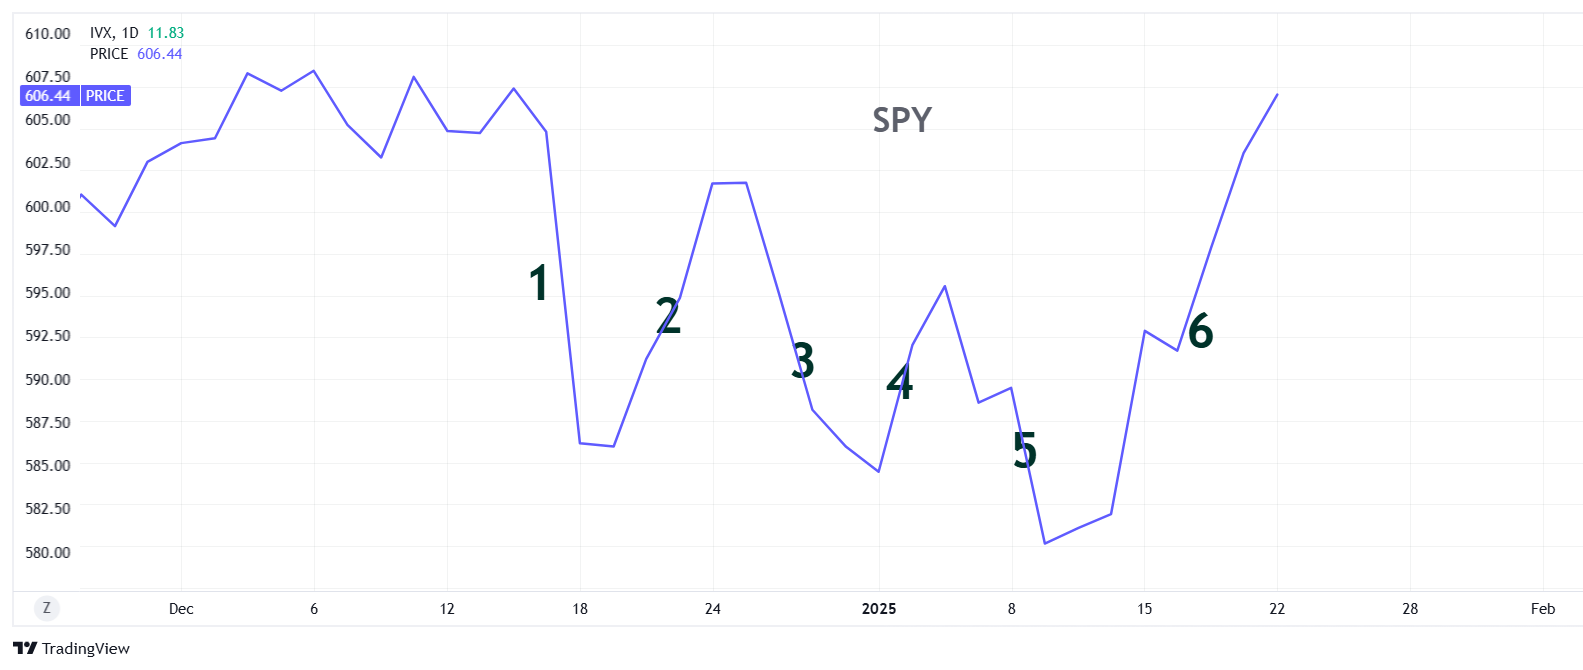
Another observation here is that VIX measures daily return variance but the market's zig-zags since mid-December have been multiday moves (more like a week). For the lack of a better word, I call this "mayhem". Mayhem can exist with or without a high level of implied volatility and may be more characteristic of the current market than high levels of VIX, which is a daily measure.

Got a question or a comment?
We're here to serve IVolatility users and we welcome your questions or feedback about the option strategies discussed in this newsletter. If there is something you would like us to address, we're always open to your suggestions. Use rhlehman@ivolatility.com.
Previous issues are located under the News tab on our website.