MBS Cumulative Defaults Calculations Under Different HPA Scenarios
December 19, 2024
What is the best way to quantify credit risk for a specific collateral type under different HPA scenarios using only data, without relying on a "black box" analyst-specific model or spending hours programming?
The steps below demonstrate how this can be efficiently achieved in the MBS Data Insights Mortgage Analyzer within a few minutes:
- Select Credit Characteristics of the Collateral
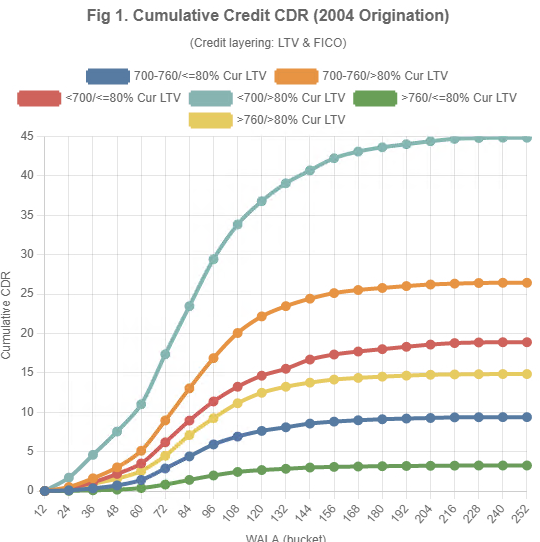
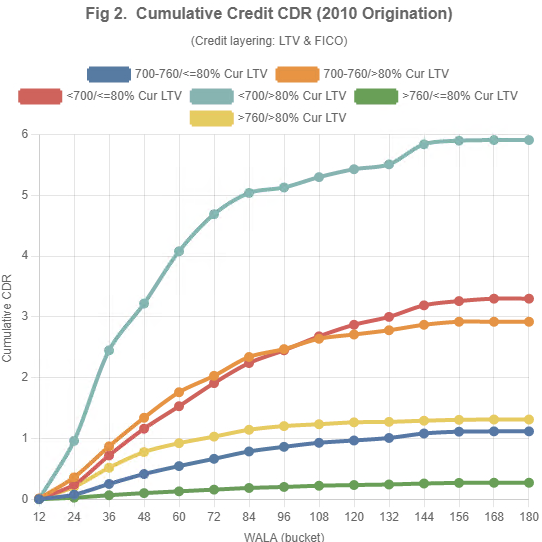
For example, Figures 1 and 2 below show collateral selected based on both Origination LTV and FICO buckets to highlight credit layering. - Calculate Cumulative Defaults
Use the Cumulative() operator to calculate defaults for vintages reflecting different HPA scenarios. For instance:- Figure 1 uses the 2004 vintage, representing a "negative" HPA scenario during the Great Financial Crisis (GFC).
- Figure 2 uses the 2011 vintage, representing a "positive" post-GFC HPA scenario.
Cumulative CDRs in the GFC scenario (Figure 1) are overly conservative for almost any future HPA projection. Conversely, post-GFC scenarios (Figure 2) may be overly aggressive, given >150% HPA up to now and strict underlying requirements. As a result, our expected Cumulative CDRs lie somewhere between these two scenarios.
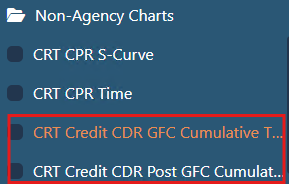
The templates used in Figures 1 and 2 can be found in the Standard Templates section:

See more details HERE.
Run the reports HERE.


Got a question or a comment?
We're here to serve IVolatility users and we welcome your questions or feedback about the MBS data insights discussed in this post. If there is something you would like us to address, we're always open to your suggestions. Use support@ivolatility.com.
Previous issues are located under the News tab on our website.