Last Week’s Highlights at IVolLive:
- Register for Our Upcoming Tuesday Webinar Tomorrow's Topic: How to Use Implied Volatility and Pricing Charts to Time and Make Actionable Options Trades HERE
- Register HERE for our free, live webinars that we host every Tuesday and Saturday at Noon EST.
- Register for a free IVolLive Trial HERE.
Inflation Data. Earnings Beats Continue. Volatility Dips.
May 8, 2023


What's Happening Now in the Markets
U.S. Equity Markets staged a strong rally on Friday on the heels of the latest jobs report. Despite continued Fed interest rate hikes, the labor market proved resilient once more.
Overall, markets ended a bit lower for the week as First Republic Bank officially went under, causing continued turmoil in the banking sector.
The Dow was flat for the week while the Nasdaq and S&P 500 dipped 1.2% and 0.8%, respectively.
Yields on the 10-year treasury note - which we've been following closely in these pages - continued inching higher, finishing the week at 3.43% (an increase of 10 basis points).
A large decline that caught our attention as that of crude oil, with WTI dropping 7% on the week to close at $71 per barrel.
This week, there should be less fireworks on the earnings front, though we have our eyes on Toyota (TM), Paypal (PYPL), and Disney (DIS).
Speaking of earnings... as of Friday, 85% of companies within the S&P 500 have reported earnings, with 79% of these beating on earnings per share, and 75% exceeding revenue estimates.
Bottom line: companies and the labor market remain resilient as they face the headwinds of rising interest rates and nagging inflation.
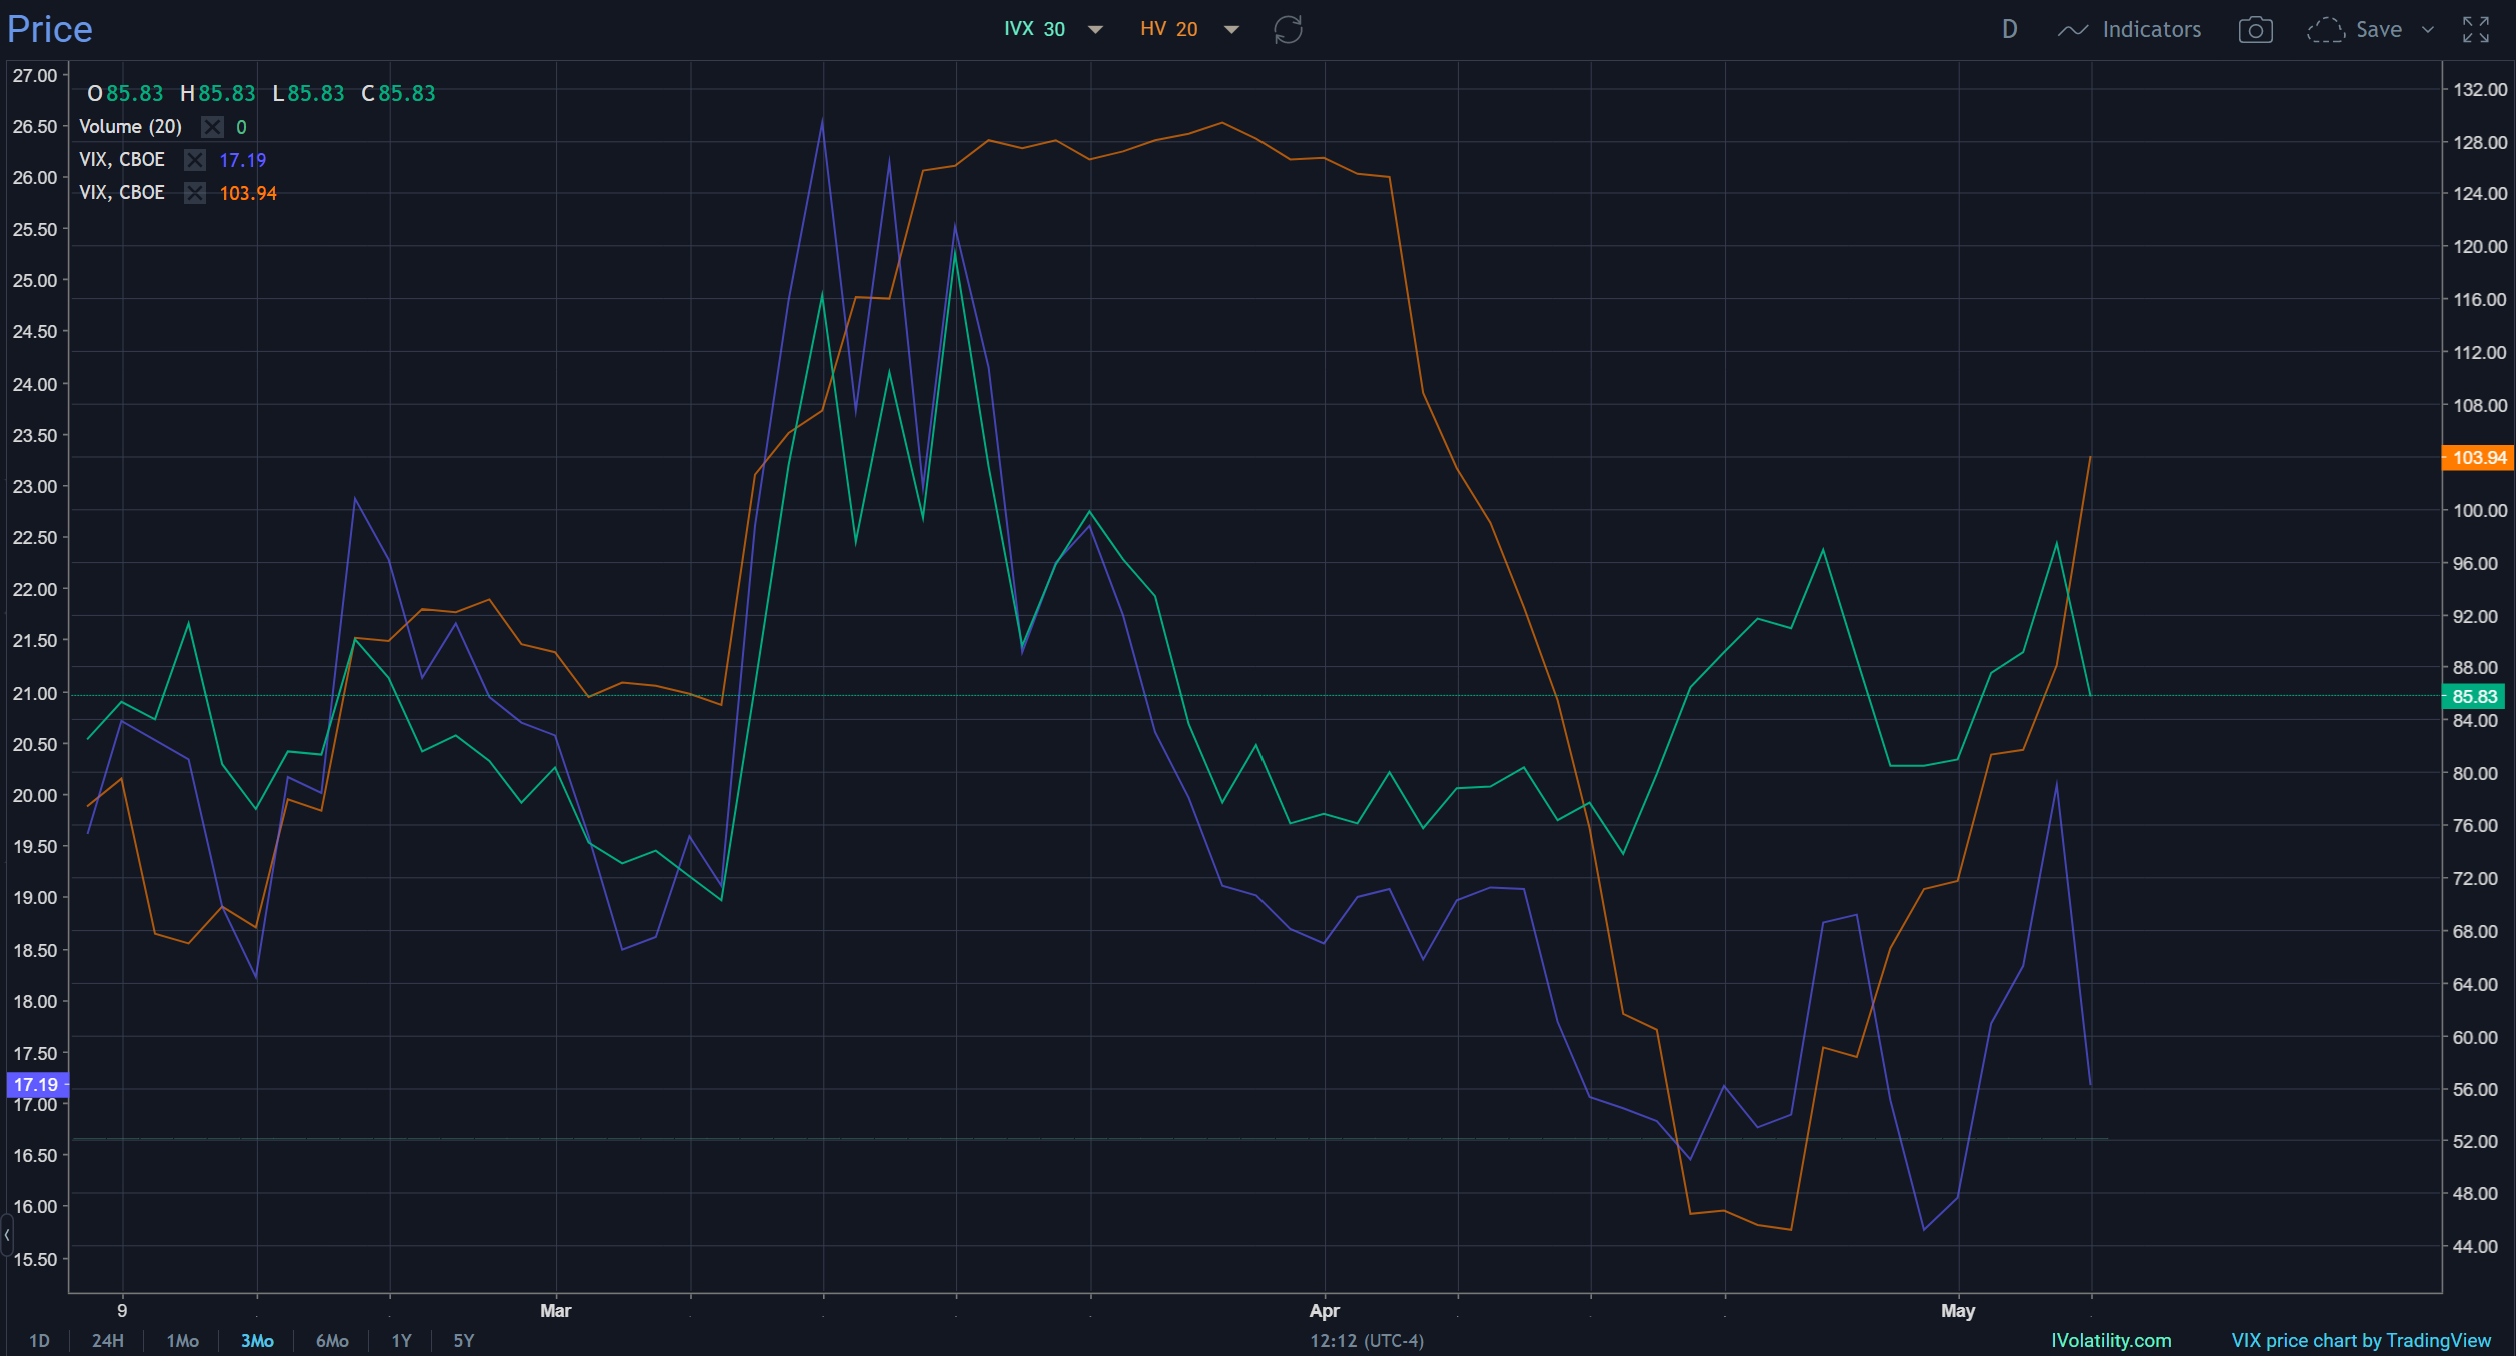
On the VIX front - the Market's "Fear Gauge" - last week we saw its implied volatility dip lower with the VIX's price. This is different than what we've been tracking in recent weeks where we found implied volatility increasing as the VIX dropped in price - a rare occurrence that typically signals volatility to come:

As you can see in this three-month chart of the market's fear gauge, the VIX, as price (the blue line) has fallen, implied volatility (green line) has finally turned lower as well.
This could signal a time of relative market calm (and cheaper option prices).
How to Play It
With implied volatility and price falling in synch on the VIX, this signals that options premiums will be falling. This means now could be a good time to go long options, or long volatility.
Interesting opportunities:
* Energy: with the fall of WTO last week, some energy names are under pressure. Now could be a good time to take the other side.
* While volatility is low at the moment, buying options on names you like could be a great strategy. We're looking at tech and energy names that beat on earnings but don't see an immediate pop in their underlying share price.
Register for a free IVolLive trial HERE.
Previous issues are located under the News tab on our website.