Last Week’s Highlights at IVolLive:
- Register HERE for our next free, live webinar that we will be hosting tomorrow at 12 Noon EST. This webinar is titled How to Use Stock Market Sentiment to Create Options Trades. Fundamental and technical analysis are useful tools in options trading. But there's another factor that really moves stock and options prices: sentiment. Understanding sentiment can be the difference maker when creating profitable options trades like puts, calls, and spreads. Join us for this free, live webinar where we will show viewers how to harness the powerful Sentiment Analyzer in IVolLive to create actionable options trades today.
- On Saturday, our experts gave a LIVE walkthrough and demo on the IVolLive platform, including how to trade puts, calls, and spreads as well as how to add features like stocks, charts, the Stock Monitor, and the Profit and Loss Calculator. Watch the video HERE.
- You can register for any of our upcoming LIVE webinars HERE.
- You can watch and view any of our past videos on our YouTube channel HERE.
- Register for a free IVolLive Trial HERE.
Changing Expectations
February 27, 2023
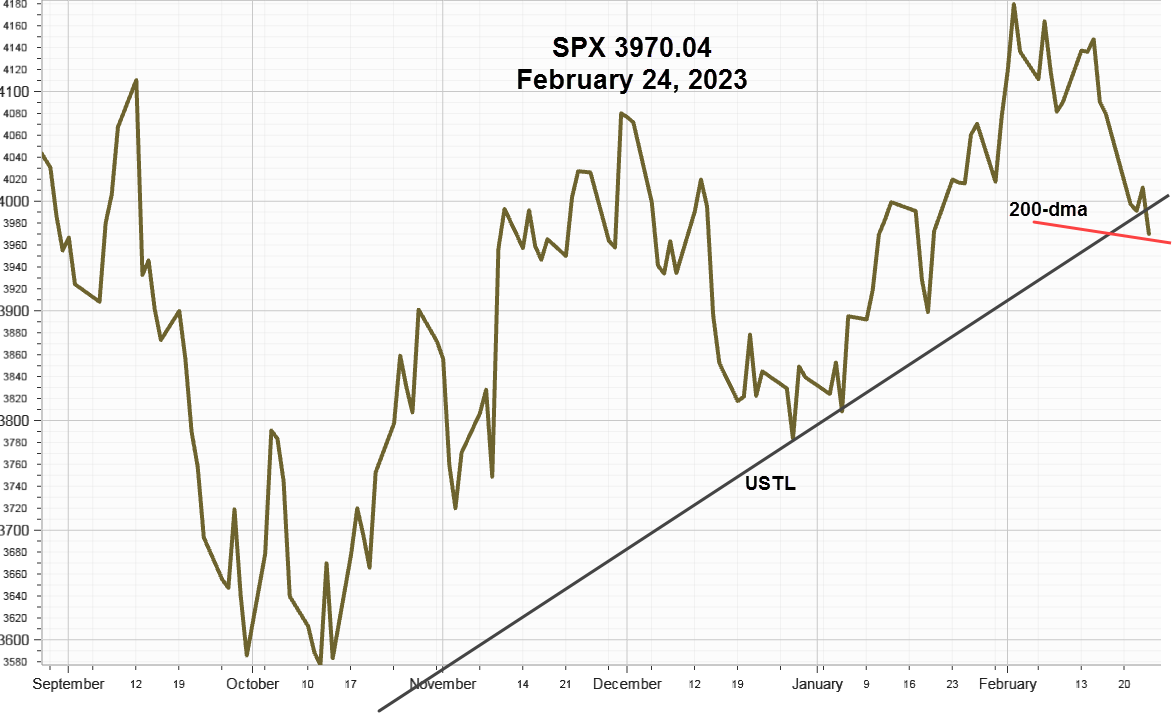
Last week the markets began tilting more toward the Federal Reserve's narrative that interest rates will go higher and stay higher longer after release of the Personal Consumption Expenditure (PCE) inflation data on Friday. Interest rates jumped up while U.S. Dollar Index continued trending higher, causing equities to slip back down to an important support level.
S&P 500 Index (SPX) 3970.04 closed 109.05 points, or -2.67% lower, ending in a narrow range just below the 50-day Moving Average and below the upward sloping trendline (USTL) from the October 13 low at 3491.58 but still above the 200-day Moving Average at 3940.12. Should it continue declining, the next stop would likely be around 3800.

The USTL begins at the wide range reversal low at 3491.58 made on October 13, below the bottom of this line on close chart. Using the October 13 close reduces the angle enough to keep Friday's close just above the USTL and right on 200- Day Moving Average 3940.12, where it will likely find some near-term support.
Implied Volatility
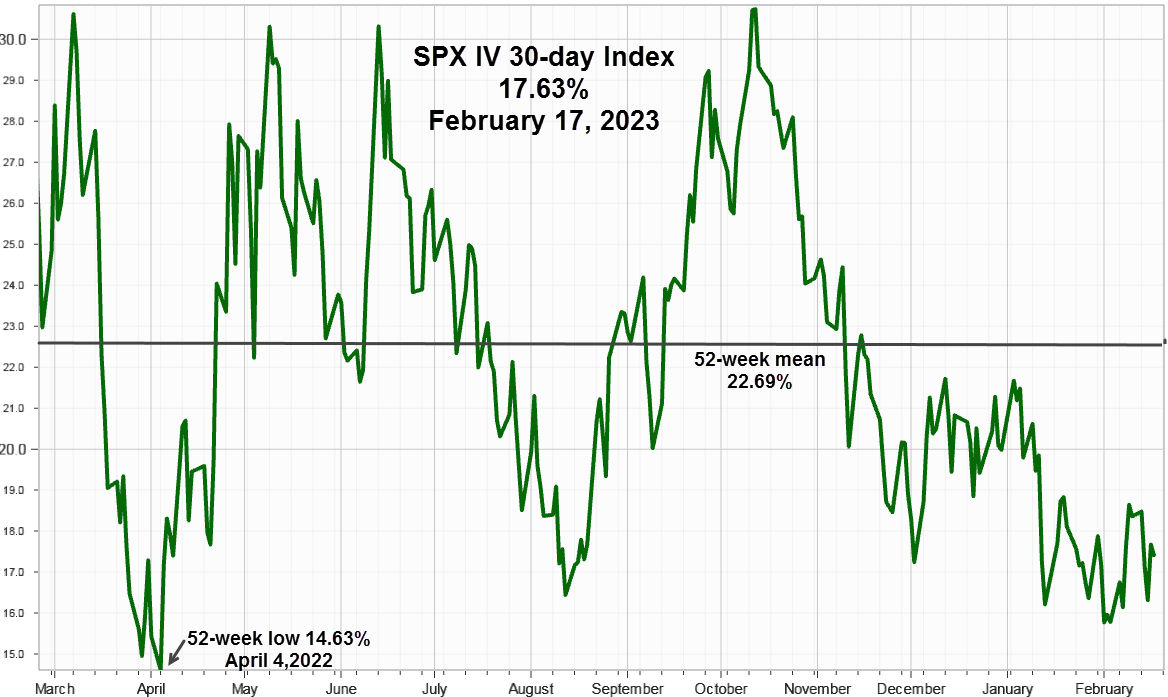
SPX 30-day options implied volatility index, IVX gained 2.30 points to end the week at 19.93%. The 7-day IVX added 1.25 points to end at 17.09%, back to a normal positive spread. The current relative low level seems to confirm acceptance of changing expectations as equities decline.
For reference keeping in mind the tendency to return to the mean, this 52-week chart shows it at 22.78%, along with the April 4, low at 14.75%.

Market Breadth as measured by our preferred gauge, the NYSE ratio adjusted Summation Index that considers the number of issues traded, and reported by McClellan Financial Publications declined at a faster rate than the week before. This time down 258.20 points vs. 136.23 points the week before to close at 591.12. From the last pivot made on February 3 at 1104.45 it's lower by 513.33 points. Although breadth may not always get market timing right, it did this time.
Summing Up
Based on increased rates and the U.S. Dollar Index after the release of PCE data on Friday market expectations appear somewhat more closely aligned with the higher for long narrative actively promoted by the Federal Reserve. With the S&P 500 Index at an important technical support level unless accompanied by some good macro or fundamental news a meaningful bounce from this level seems unlikely. After testing support around the 200-Day Moving Average, a return to around 3800 seems more likely.
Previous issues are located under the News tab on our website.