Last Week’s Highlights at IVolLive:
- On Tuesday, our IVolLive experts gave an extensive walkthrough on how to use our powerful Sentiment Analyzer to evaluate specific stocks and to run screens to find new trades. Watch the video HERE.
- On Saturday, our experts gave a LIVE walkthrough and demo on the IVolLive platform, including how to add features like stocks, charts, the Stock Monitor, and the Profit and Loss Calculator. Watch the video HERE.
- You can register for any of our upcoming LIVE webinars HERE.
- You can watch and view any of our past videos on our YouTube channel HERE.
- Register for a free IVolLive Trial HERE.
More Bull or Bounce?
February 6, 2023
Viewed through a technician's lens, the S&P 500 Index downtrend ended on January 20 when it finally crossed above the 200-day Moving Average after several failed attempts. As the bulls open up the throttle, the fundamentalists expecting a recession later in the year, say not so fast, pointing out renewed advances by meme stocks and SPACS, make the current advance as just another bear market bounce with classical "push and pull" narrative from banks, brokers, and advisers.
S&P 500 Index (SPX) 4136.48, advanced 65.92 points, or +1.62%, last week including a 42.61 point gain after Jay Powell's rate hike commentary on Wednesday on increased volume. On Thursday, it made a bullish golden cross when the 50-day Moving Average closed above the 200-day Moving Average on higher than average volume. Friday's stronger than expected employment report, whacked both bonds and the U.S. dollar, knocking it back down a bit, as big cap favorites with significant overseas sales declined.

The next objective, located at the August 18th bear bounce at the 4325, will determine how much Friday's rate and U.S. dollar hikes slow the upward trajectory. Once above this level, the odds for a Head & Shoulders Bottom pattern greatly increase as bear short covering fades.
After previously mentioning a potential Head & Shoulders Bottom pattern, the chart above fills in the details. The downward sloping trendline, DSTL, starts at the January 4, 2022 high of 4,818.62 (not shown) that ended January 20th, which also becomes the neckline of the pattern assuming the new upward sloping trendline USTL, and the December 22, Right Shoulder holds. Adding the distance from the Head to the neckline of 708 points produces an upside measuring objective at 4708, back up near January 2022 high.
Implied Volatility
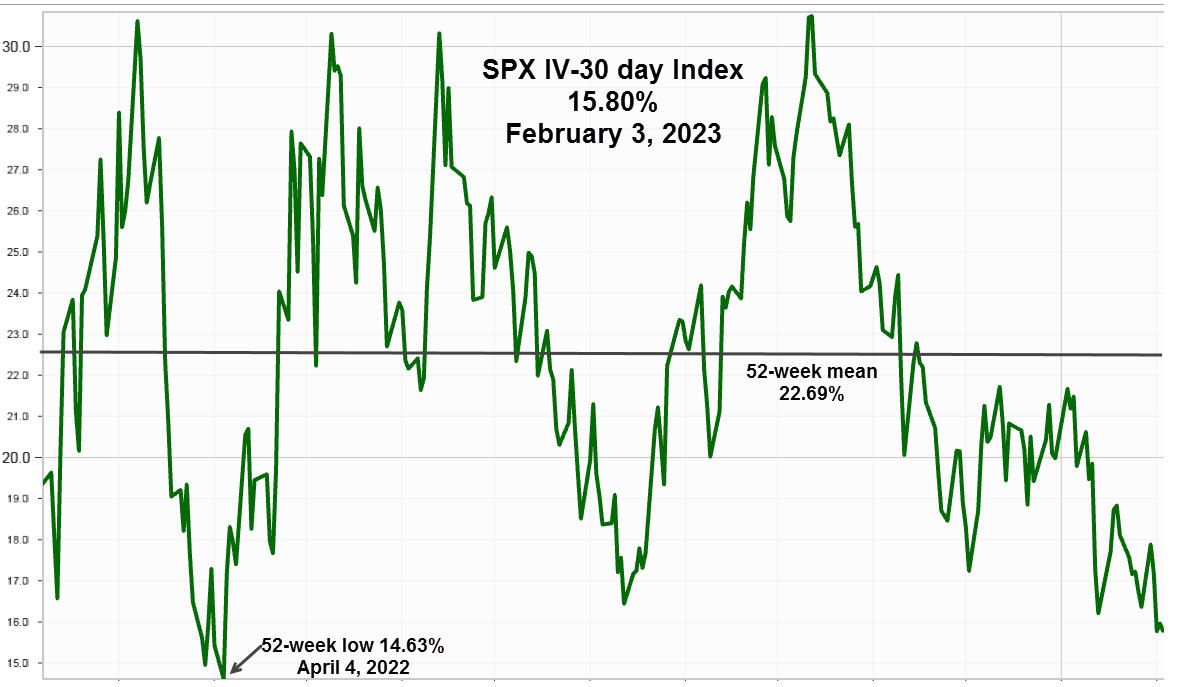
SPX 30-day options implied volatility index, IVX, slid .64 points to end at 15.80%, while the 7-day IVX dropped 4.73 points to 16.02%, as near-term hedging relaxed after last week macro events and earnings reporting. While most market indicators show what happened, option implied volatility adds definitive information about positioning for what's anticipated for individual stocks, indices and ETFs, as well as the VIX, options on VIX futures, and an out-of-the-money Skew Index.
Since it eventually reverts to the mean, the 52-week chart shows it at 22.69%, along with the April 4, low at 14.63%.

Market Breadth as measured by our preferred gauge, the NYSE ratio adjusted Summation Index that considers the number of issues traded, and reported by McClellan Financial Publications, marched higher by adding another 219.15 points to end the week at 1104.45, exceeding the August 18, 2022 high at 859.79. This is another vote for the bullish view.
Summing Up
Last week, the S&P 500 Index created an event packed thriller as it gained or lost more than 1% everyday, about as smooth as riding on a camel, as losses bookended the week Monday and Friday with gains in the middle. However, the advance from the October 14, 2022 low increased the odds enough to declare an increased likelihood for the completion of a Head & Shoulders Bottom pattern.
While the bulls have the advantage, the full impact from Friday's employment report could take awhile as rates and the U.S Dollar again draw some attention away from earnings after the cap favorites reported earnings.
Previous issues are located under the News tab on our website.