Keep at it until the Job is done
September 26, 2022
Federal Reserve Chairman Powell's unambiguous message last Wednesday came in loud and clear. "We will keep at it until the job is done." The Fed raised the fed funds rate by another 75 basis points to 3%-3.25% and issued new projections showing rates peaking at 4.6% next year with no cuts until 2024. When pressed to declare the exact terminal rate Powell said, "It will be enough."
It seems they have no intention to take their foot off the breaks anytime soon. Like hitting a donkey in the head with a 2x4, the markets finally got it. The S&P 500 Index along with other risk assets quickly turned lower as rates advanced.
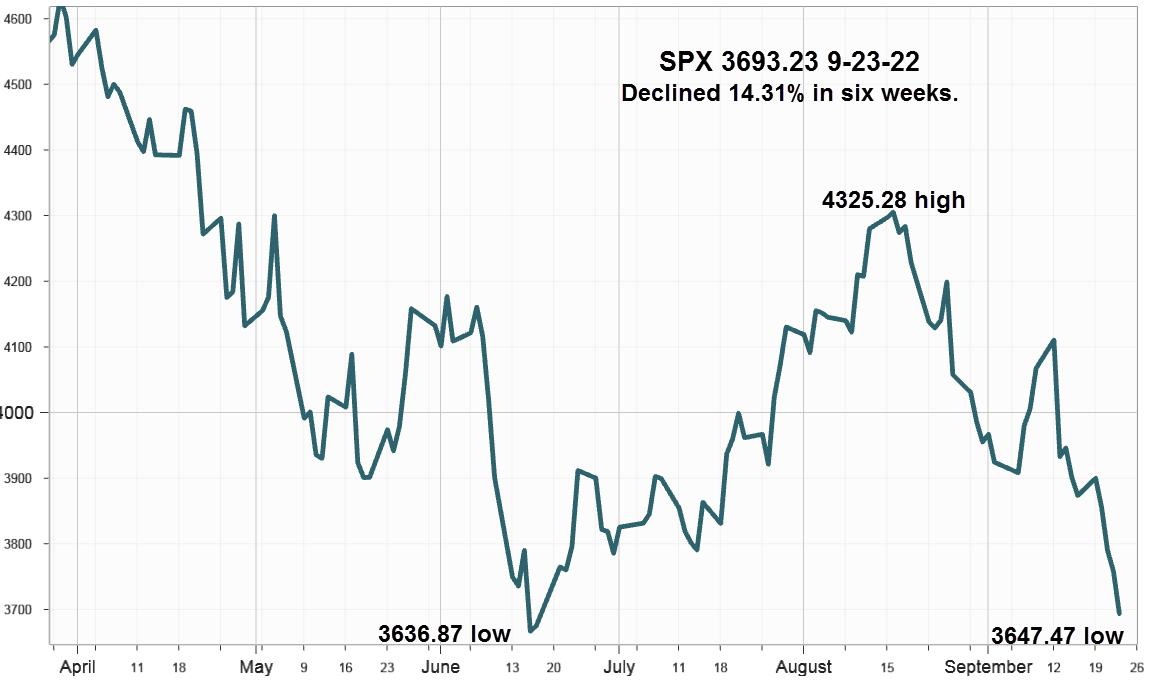
S&P 500 Index (SPX) 3693.23 declined 180.10 points or -4.66% last week as it retested the June 17 low at 3636.87 reaching 3647.47 before closing slightly higher. After Powell's comments, the retest came much sooner than expected. While the 14-day relative strength index (RSI) at 28.90 suggests its oversold and due for another bear market bounce, the Dow Jones Industrial Average (DJI) and the iShares Transportation Average ETF (IYT) closed below their respective June lows creating some doubt that any oversold bounce could last very long. Supporting the potential bounce scenario the Invesco QQQ Trust (QQQ) and the iShares Russell 2000 ETF (IWM ) managed to close above their June lows.

After maintaining relative strength for months, the Energy sector finally joined the rout declining 6.75% on Friday as WTI Crude Oil broke below support at 80 and dropped 5.69%, basis November futures. Although likely to join any oversold bounce, without the energy sector it's going to be tough sledding for equities.
Interest Rates
For the week, the 10-Year Treasury Note ended at 3.69% up 24 basis points (bps). The 2-Year Note increased even more adding 35 bps to 4.20% for a 10-2 inversion of -51 bps compared to -40 bps the week before. Rates rising faster at the short end thereby creating inversion, forewarns of a recession and declining asset prices.
Market Breadth as measured by our preferred gauge, the NYSE ratio adjusted Summation Index that considers the number of issues traded, and reported by McClellan Financial Publications continued lower again last week declining 379.40 points to end at -514.32, now below the 200-day Moving Average -262.09.
Implied Volatility
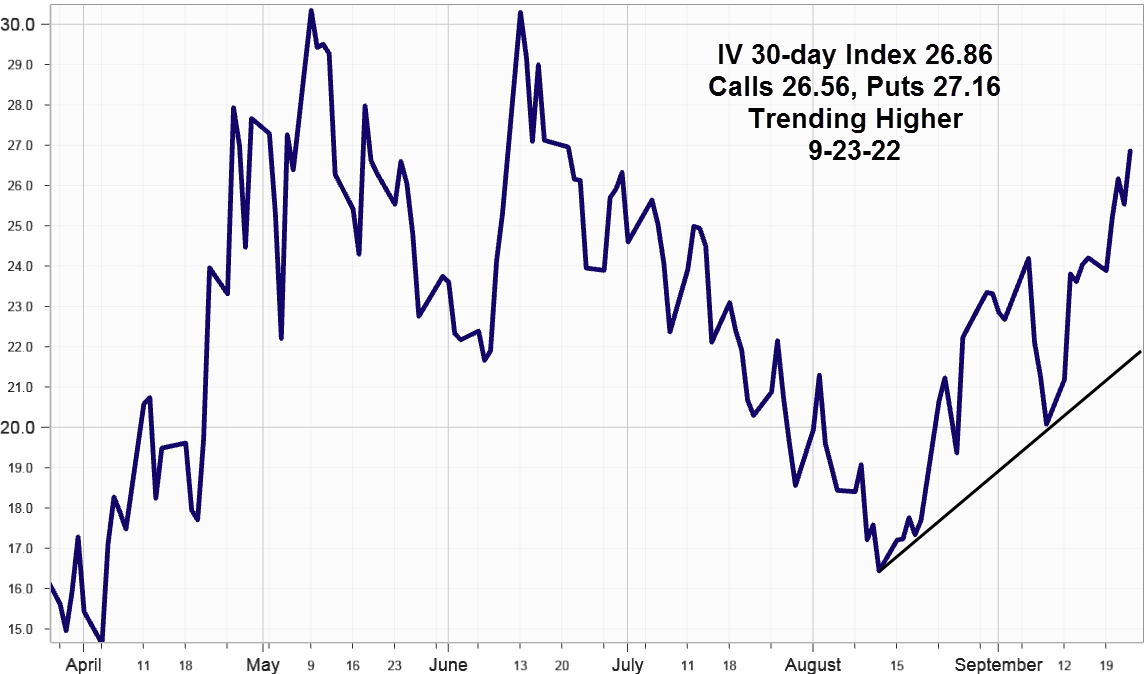
SPX options implied volatility index, IVX advanced 2.65% to 26.86% from 24.21% on September 16 with the Calls at 26.56% and Puts at 27.16% slightly skewed.

The equity only put call ratio ended Friday at 1.02, the highest since March 12, 2020 at 1.28 during the Covid panic and the next highest at .89 on June 10. In the past, high spikes provided short-term buying signals and combined with other oversold indicators increases the odds for another oversold bear market bounce. This could be a good time to consider collars (long put and short call) for existing long positions.
Summing Up
Last Wednesday's 75 bps hike to the fed funds rate seemed reflected in the prices of fixed income and equities before Powell addressed the media to emphasize their determination to keep hiking rates "...until the job is done." This time the markets got the message as rates quickly headed higher and equities turned lower.
Unless something breaks, the Fed expects rates to peak at 4.6% next year with no cuts until 2024. Although the game of guessing the terminal rate ended last Wednesday, expect challenges from analysts on both sides of the issue to continue commenting and offering conflicting opinions.
Friday's WTI crude oil breakdown and close below support added weight to the recession view as the energy sector quickly moved to catch other sectors heading lower.
Although the RSI and equity only put call ratio indicate an oversold market due for a bounce, contrarian dip buyers can expect it to be like trying to walk up a down escalator until the Fed stops rising rates.