Market News & Research June 21, 2022 Bottom Signs |
Although not unanimous, some indicators typically seen at market bottoms now show early signs of excessive selling pressure. For example, on Friday June 10, the equity only put call ratio reached .89, above the next previous high made on April 22 at .87 just as the current downleg began. Last Thursday June 16, it reached .86 with the 5-day average at.79. However, since monthly June options expired along with futures on Friday, unwinding and closing positions boosts volume for options, stocks, futures and ETFs. |
On Monday June 13, the NYSE common stock Advance Decline Ratio registered -957.92, the lowest level since March 2020, while the S&P 500 Index Advance-Decline Volume ended at -2995.18, not quite as low as on November 30, 2021 at -3450.21. Previously since low levels such as these, preceded oversold bounces, the odds favor another bear market bounce that should get underway soon, with the final bear market bottom still yet to come. |
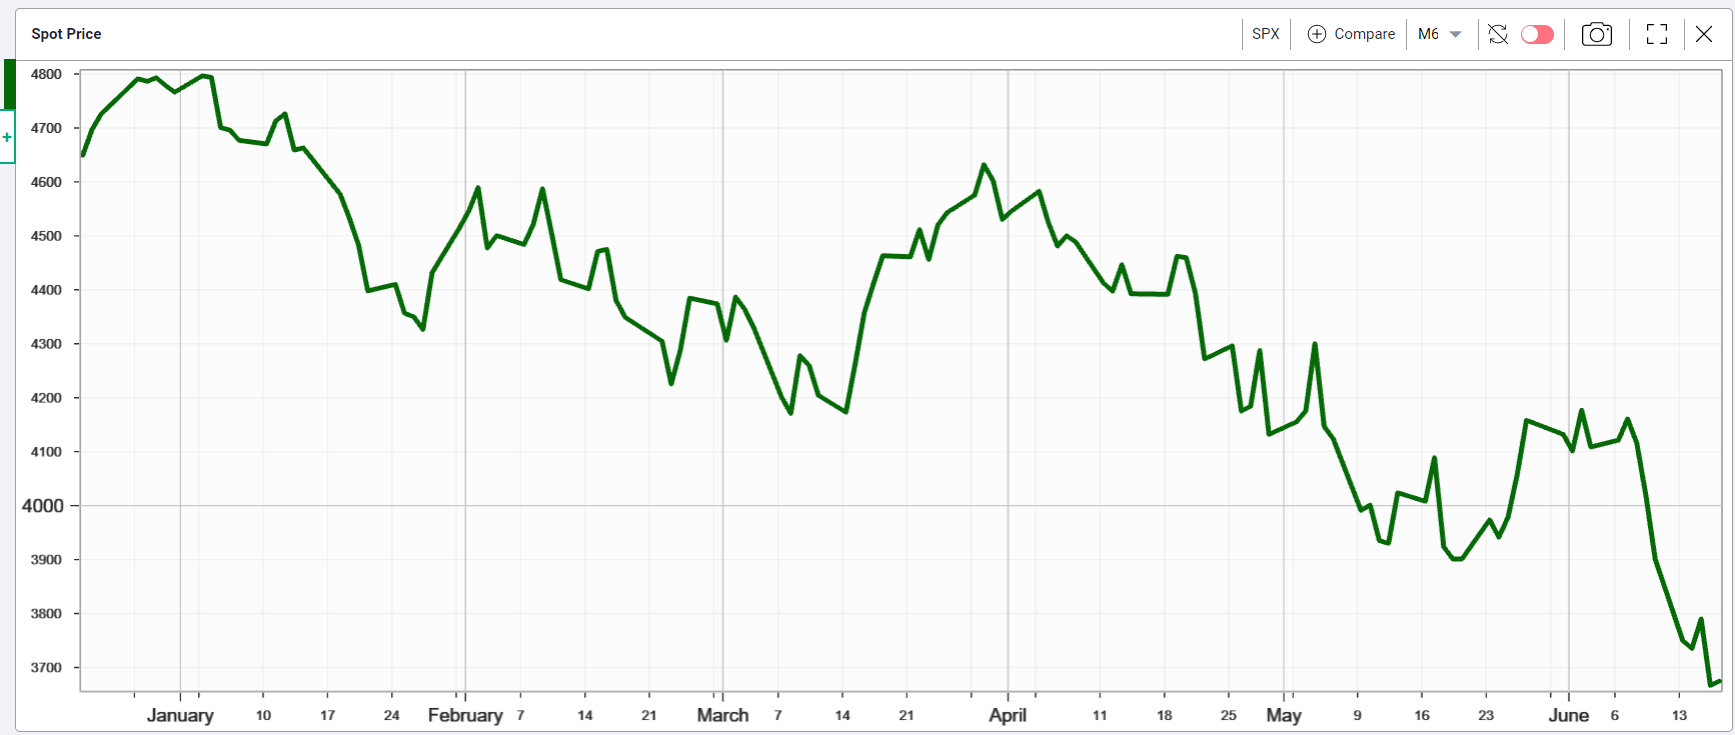
S&P 500 Index (SPX) 3674.84 slid another 226.02 points or -5.79% in addition to the 358.91 point or -8.94% decline the previous week ending June 10. Options and futures expiration on Friday helped stabilize Thursday's 123.22 point decline as volume increased to 4.6 billion shares likely due to efforts to limit in-the-money put exercise exposure. The two open downside gaps made first on Friday June 10, and then Monday June 13, increase the odds of an oversold bounce with the RSI at 31.77. With some favorable news, it could even bounce back up toward the 50-day Moving Average at 4117.17. |
Since the intraday high at 4818.62 made on January 4, to Friday's intraday low at 3636.87, SPX declined 1181.75 points or -24.53% in fewer than five and one-half months, qualifying for the arbitrary and meaningless bear market designation. While some may conclude that the decline so far increases the final bottom probability, a bounce seems more likely as long inflation and interest rates continue rising. In addition, earnings estimates don't yet reflect declining consumer sentiment and the earnings drag from the higher U.S dollar compared to both the developed and emerging markets. Earlier records of turning up ahead of downward earnings revisions lack any useful consistency. |
Further supporting the bounce view, the Energy sector that previously supported the major indices, joined the slide south last week amplifying downward pressure and perhaps contributed to unusual options activity that may not continue as long as fundamentals remain constructive. However, last week's sector decline implied growing recession worries that could begin lowering crude oil demand. |
The SPX chart shows last Wednesday's 54.51 point bounce before heading lower Thursday: |
|
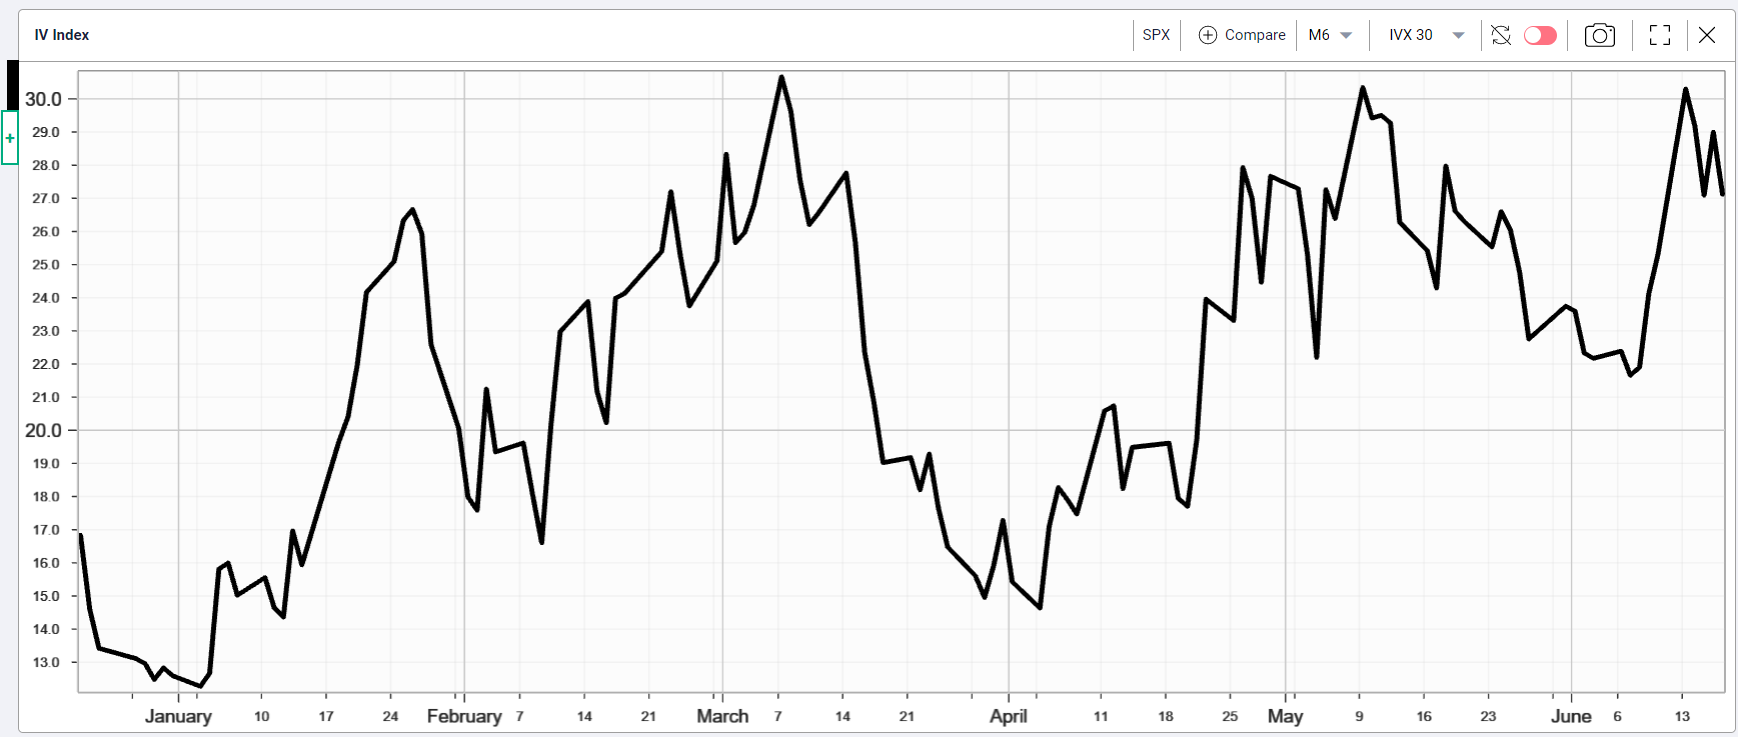
From the perspective of the SPX options market, IVX, implied volatility gained 1.81or 7.15% last week after reaching 30 % early in the week then declining slightly to end at 27.12% vs. 25.31% on June 10 as shown in the chart below. |
|
While the level of some indicators suggest a potential market bottom, until interest rates show signs of peaking and earnings estimates begin including a potential recession, the current oversold market condition likely represents an opportunity for another bear market bounce soon to get underway. |

