We offer multiple professional grade services to help you gain insight on volatility trading. Do not hesitate to try our products FOR FREE by clicking HERE |
Market Update |
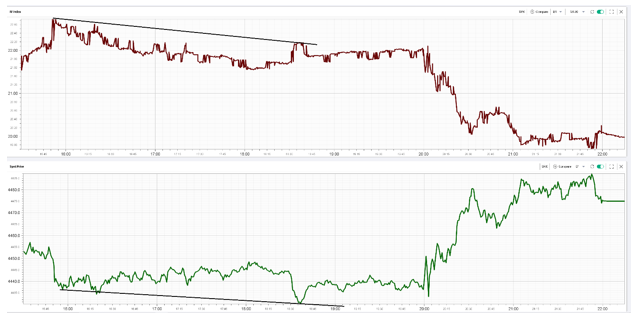
Based on the unchanged closing levels in headline indices, one could think that very little happened during yesterday’s session. In reality though we still witnessed a 1.2% intraday range in the SPX and a 1.7% range in the NDX. The early selloff that started during the European hours was reversed going into the close. |
An intraday Spot/Vol divergence was observed in the market, a phenomenon that we discussed at length in the following WEBINAR |
|
In Europe, a fairly similar session happened although Banks seemed to be struggling a bit more than the broader market with the SX7E down almost 1.5%. |
At a single stock level, the activity in spot and implied volatility was fairly muted as participants seemed to be more focused on squaring off positions going into February expiration tomorrow. |
GS was an obvious laggard on the day down 1% vs the DOW almost unchanged. Despite that spot performance 30d IV was around 1.5 points lower and underperformed all other DOW components from that perspective as well. |
On the earnings front, ABNB was up almost 4% on the day but the IV crush remained significant with 30d IV finishing around 11 points lower. |
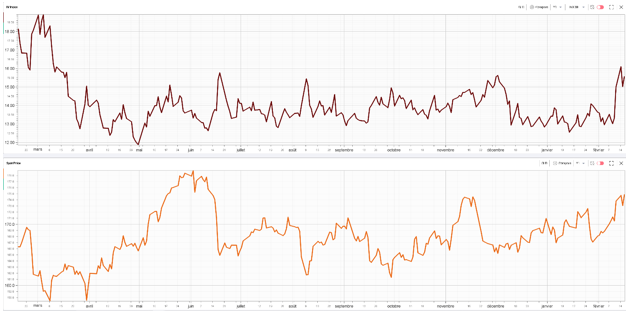
Macro wise, GLD caught a slight bid and finished the day around 1% higher. Despite the commodities ETF being stuck in a 10% range for the best part of the last 12 months its 30d IV remains elevated relative to its history trading in its 90th percentile. |
|
In a sign that tensions continue to moderate, the SPX Term Structure continued to normalize (Red asof Wednesday, Yellow asof Tuesday). |
|
All buckets traded meaningfully lower although the kink visible in the 30-day bucket remains in place for now. Option activity for expirations in March 2022 remains significant with around $50bln of notional trading yesterday with the largest traded strikes including the 5,000 and the 4,000 amongst others. |
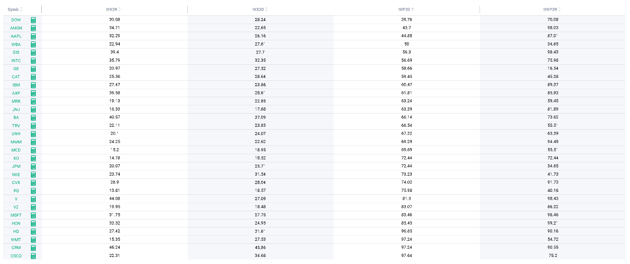
Using the Stock Monitor, we sort the components of the DOW by the percentile of their implied volatilities. AAPL remains one of the better ranked names from that perspective as it currently trades in its 45th percentile (30d IV over the last 12 months). This is particularly interesting in light of the fact that its realized volatility is historically elevated sitting in its 87th percentile for HV20. |
|
On the other hand, PG 30d IV sits in its 76th percentile while 20d HV trades around the 40th percentile. |
| Disclaimer - This information is provided for general information and marketing purposes only. The content of the presentation does not constitute investment advice or a recommendation. IVolatility.com and its partners do not guarantee that this information is error free. The data shown in this presentation are not necessarily real time data. IVolatility.com and its partners will not be liable for any loss or damage, including without limitation, any loss of profit, which may arise directly or indirectly from the use or reliance on the information. When trading, you should consider whether you can afford to take the high risk of losing your money. You should not make decisions that are only based on the information provided in this video. Please be aware that information and research based on historical data or performance do not guarantee future performance or results. Past performance is not necessarily indicative of future results, and any person acting on this information does so entirely at their own risk. |


